Operations | Monitoring | ITSM | DevOps | Cloud

Monitoring

The latest News and Information on Monitoring for Websites, Applications, APIs, Infrastructure, and other technologies.

Common pitfall of addressing registry entries in 64-bit operating system

Accessing Windows registry (local or remote) is a typical way of gathering useful data. However, there’s a typical pitfall that can cause unexpected scripts or programs behavior. Namely, accessing registry values across different architectures (say, 64-bit entries from 32-bit applications).

From Forms to Reforms: ITSM for a Simplified Employee Onboarding Process

As per research published by Hosting Advice, over 56% of employees who felt disengaged at work marked inadequate training as the key reason for it. Over 53% of employees felt that they would be able to perform better at their jobs if they received adequate training. And over 31% of respondents to the research survey stated that they had to quit their jobs less than six months after being hired. Olivia was one of those last set of employees at her first job out of graduate school.

Part One: How to Build Monitoring Dashboards based on Grafana with Logz.io

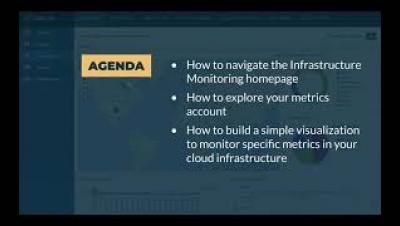
Logz.io customers use our Infrastructure Monitoring product to collect, store, and analyze metrics. In this webinar, Daniel and Noa will explain some of the basics of getting started with the product and cover some recent product additions with Grafana 7.

Create a Cloud Migration Strategy with IT Infrastructure Monitoring

The rapid pivot towards a remote workforce is forcing organizations to adopt a cloud-first approach faster than ever. We recently surveyed 500 IT decision-makers around the globe to ascertain their views on IT automation, cloud migration, and business continuity in the face of unexpected crises. The survey found that 87% of IT professionals agree that the current COVID-19 pandemic will cause organizations to accelerate their migration to the cloud.

Introduction to instrumenting applications with Prometheus

As a developer, getting metrics from your application onto a Prometheus graph can seem daunting. We’ll look at analyzing your service to find the most useful places to add metrics, how to add that instrumentation, getting it exposed and scraped, and then basic queries to use those metrics on graphs. Check out another article of mine for general reference on instrumenting, this one on Prometheus metrics, or this comparison on instrumentation alternatives.

Enterprise Service Management & IT Operations Management Coming Together

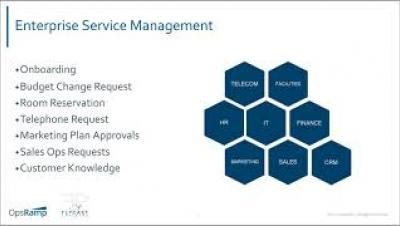
IT Service Management (ITSM) has moved beyond IT and is now often referred to as Enterprise Service Management. Similarly, IT Operations Management (ITOM) has gone beyond disparate monitoring tools and single pane of glass promises to focus on the broader needs of digital operations. In this Tech Talk, FlyCast Partners will join us to discuss Enterprise Service Management - what's changed, what's next and how does it intersect with modern digital operations.