Operations | Monitoring | ITSM | DevOps | Cloud
Monitoring
The latest News and Information on Monitoring for Websites, Applications, APIs, Infrastructure, and other technologies.
Why the Modern Enterprise needs an Early Warning System
Today’s enterprises are embracing digital transformation and modernizing their infrastructure to deliver products faster and stay ahead of the competition. Here at LogicMonitor, we usually see the result of this modernization as a distributed and hybrid IT infrastructure that allows enterprises to optimize factors like cost and security while still realizing the benefits of being able to scale and deploy faster.
Top 3 Ways to Identify Root Cause of Poor Performance Issues in Your Citrix or VMware Horizon Deployment
Enterprise troubleshooting is not an easy task with many enterprises. Administrators are typically left maintaining many different solutions, attempting to evaluate root cause manually, or are left with solutions that do not give broad visibility into all aspects of the deployed Citrix or VMware Horizon deployment. This can leave systems down for longer than necessary and can leave administrators in a tough spot. We covered some of these pain points previously and can be found here.
Provisioned Concurrency - the end of cold starts
AWS today announced Provisioned Concurrency, an exciting feature to allow Lambda customers to not have to worry about cold starts anymore. And we at Lumigo are proud to be an official launch partner for AWS Provisioned Concurrency. In this post we’ll drill into the problems cold starts pose, explore how Provisioned Concurrency resolves them, and explain some rough edges you need to understand when it comes to working with this new feature.
The future of Pandora FMS: 2020-2021 roadmap
Some of the most common questions we face daily are related to our future plans or the roadmap of Pandora FMS. Thanks to our customers and users, we know you expect us to integrate increasingly more features into the Pandora FMS interface and architecture. But it is not just about improving what we already have to make it more efficient, user-friendly and fast, but about going beyond, much further.
External collection for Elastic Stack Monitoring is now available via Metricbeat
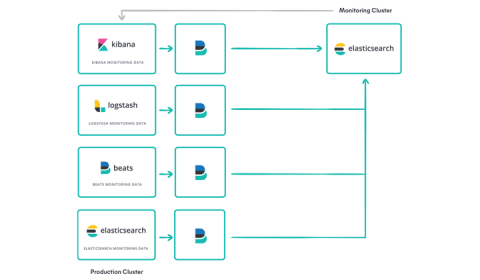
We are pleased to announce the general availability of external collection for Elastic Stack Monitoring. With this announcement comes the ability to monitor Elasticsearch, Kibana, Logstash, APM server, and Beats all via Metricbeat modules. Using external collection, users now have the capability to collect and send monitoring data for their Elastic Stack without having to depend on the health of the monitored services.
OpsComm Fall 2019: IT Operations Research and OpsRamp Platform Updates
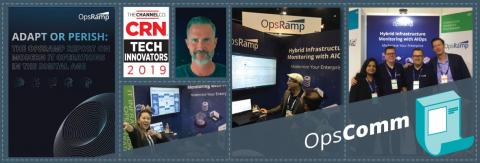
During October and November, OpsRamp unpacked our Fall Release, issued a new report on modern IT operations, sponsored two Gartner conferences, announced a new VP of Worldwide Channel Sales and received recognition from CRN as a technology innovator. We also published plenty of viewpoints on the future of digital and IT operations management. So, take a break from the Impeachment proceedings and read up on what you missed here!
What Are Java Agents and How to Profile With Them
Java agents are a special type of class which, by using the Java Instrumentation API, can intercept applications running on the JVM, modifying their bytecode. Java agents aren’t a new piece of technology. On the contrary, they’ve existed since Java 5. But even after all of this time, many developers still have misconceptions about this feature—and others don’t even know about it. In this post, we remedy this situation by giving you a quick guide on Java agents.
Monitoring and observability:
Monitoring versus observability is a hotly debated topic. It’s been argued that they’re two distinct things — the former just a high-level overview of a problem after the fact, while the latter enables you to be proactive. Observability has also been dismissed as jargon, much how “DevOps” sounds to the seasoned operator.
BugSplat's New Look
Today we're announcing BugSplat's new look to our customers via email. We've made some pretty significant updates, and we're excited to walk you through them.


