Operations | Monitoring | ITSM | DevOps | Cloud
Monitoring
The latest News and Information on Monitoring for Websites, Applications, APIs, Infrastructure, and other technologies.
Using Dynamic Thresholds to Eliminate Noise and Focus on What's Important
When most people hear ‘dynamic thresholds’ in the context of monitoring, they think of the ability to trigger alerts based on a non-static threshold. While this can be incredibly useful, it’s really only half the picture.
8 Citrix Virtual Apps and Desktops Policies You Should Consider Tweaking
You have just deployed a new Virtual Apps and Desktops Site for your customer. You thought about what policies should apply in the environment, however you can’t possibly know them all. So, what you will want to do is to before deploying anything to end-users is shift through all the Citrix Policies on offer and configure them appropriately based on business needs and end-user requirements. There are many policies available. Luckily, you will likely not need to touch 80% of them.
NGINX vs Apache - Which Web Server Is Right for You?
Today's IT and DevOps teams have not one, but two, feature-rich open source Web servers to choose from: NGINX and Apache HTTP Server (which is often called simply "Apache"). At a high level, both platforms do the same core thing: Host and serve Web content. Both also offer comparable levels of performance and security. Yet when you dive into the details, you'll find that there are many differences between NGINX and Apache.
Monitor AWS IAM Access Analyzer findings with Datadog
As you monitor the health and performance of your infrastructure and applications, you also need to be able to identify potential threats to the security of those components. To help address this challenge, we’re pleased to announce that Datadog now integrates with AWS Identity and Access Management (IAM) Access Analyzer, a new IAM feature that helps administrators ensure that they have securely configured access to their resources.
Where is the enterprise network market heading in 2020?
The networking field is changing quickly with the emergence of new technologies. This change, along with the onset of digital transformation and increasing cloud-adoption, highlights how businesses have realized the importance of the third platform, as it interconnects mobile computing, cloud computing, social media, and information analytics. 2019 has been the year of edge computing and the dawn of the SD-WAN.
[PromCon Recap] A Look at TSDB, One Year In
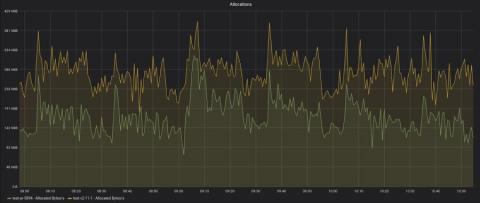
This is a writeup of the talk I gave at PromCon 2019. TSDB is the storage engine of Prometheus 2.x. Based on the Gorilla compression, it started out in an independent repo, which eventually attracted 60+ contributors and 771 stars. There were 500+ commits after the Prometheus 2.0 release. The repo was archived in August 2019, and now it’s a part of the Prometheus repo, inside the tsdb directory. Here are some highlights of the development over the past year.
Magecart Monthly: Holiday shoppers targeted at Macy's & Sweaty Betty
Holiday shopping is in full swing and cybercriminals are preparing their campaigns to maximise their profits this season. Here’s the latest news on Magecart and other website attacks, with insights from our own Security Researcher!
How to Troubleshoot Poor Session Performance within your Citrix or VMware Horizon Environments
Alternative to Splunk: Pandora FMS as a monitoring tool
The American magazine “Fortune” specializes in global banking, business and finance… What does it have to do with monitoring? Well, in one of its annual lists, the Fortune 100 (the largest companies on the planet), 92 companies use Splunk software… If we compare by volume of money, yes, Splunk would be the best software and that’s where this article would end.


