Operations | Monitoring | ITSM | DevOps | Cloud

Monitoring

The latest News and Information on Monitoring for Websites, Applications, APIs, Infrastructure, and other technologies.

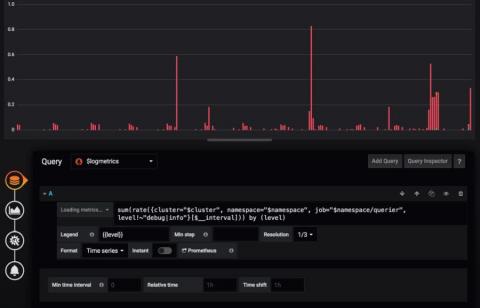
What's New in Loki v0.4.0

More frequent releases! We continue to march Loki towards the first GA release, and to help that process we are going to target bi-weekly to weekly releases, depending on changes. - Ed Welch 08/12/2019 My mistake, there was clearly a typo in my previous post, and when I said bi-weekly I clearly meant bi-monthly. ;) The good news, however, is that the project has been very busy and there are some very exciting new features in Loki v0.4.0!

JVM Tuning: How to Prepare Your Environment for Performance Tuning

When it comes to Java applications, to make sure they run at peak performance, it’s critical to close the resource gap between the code and the virtual machine it’s running on – if there is one. The way to do that is by peaking into and fine-tuning the Java Virtual Machine (JVM). However, that’s easier said than done. Many factors can influence JVM performance, and during tuning, you must consider all of them. Though, there are ways around that to make it not be such a pain.

Monitoring Google Cloud Platform with Stackdriver and Logz.io

We’re happy to announce a new integration with Google Stackdriver, allowing users to easily ship data from Google Cloud Platform into Logz.io via Google Pub/Sub! Early adopters of Google Cloud may recall that they were pretty much in the dark as far as logging their projects was concerned. Sure, they could access their virtual machines and manually grep log files but that was pretty much it. With this new integration, we can import logs from Stackdriver into Logz.io.

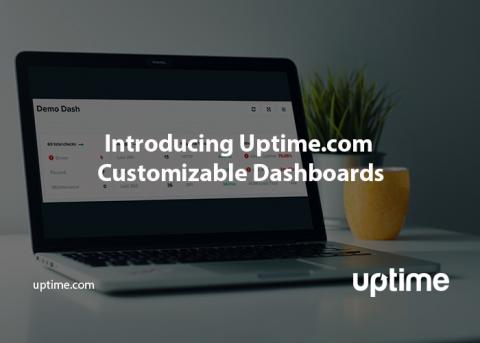
Introducing Uptime.com Customizable Dashboards

Dashboards do their job best when they are a centralized space for the data you need. Not all data, but specifically those key performance indicators that drive the decision making at the top. Uptime.com created a customizable dashboard system that brings that level of personalization to you and your organization.

Beware of black cats and black hats this Halloween

It’s that time of the year again when you sport your favorite costume, carve pumpkins, gear up for trick-or-treating, and reread Gothic stories. It’s almost Halloween! There is no denying that October is all about ghosts and ghouls, tricks and treats, witches and wizards, pirates and pumpkins. However, October is also National Cybersecurity Awareness Month (NCSAM), a time to remember that alongside our cogent fears lies another reality that’s much more ghastly—cyberattacks.

Monitoring .NET Core - Raygun's multithreaded trace capability explained

Raygun’s CTO Jeremy Norman chats with Alex Williams of The New Stack to give a technical demo of the multithreaded trace feature in Raygun APM. Jeremy offers practical examples of how traces work, how you can monitor microservices more accurately, and why Raygun is different from other APM tools.

How to monitor Kubernetes + Docker with Datadog

Since Kubernetes was open sourced by Google in 2014, it has steadily grown in popularity to become nearly synonymous with Docker orchestration. Kubernetes is being widely adopted by forward-thinking organizations such as Box and GitHub for a number of reasons: its active community, rapid development, and of course its ability to schedule, automate, and manage distributed applications on dynamic container infrastructure.

Monitoring AWS FSx with LogicMonitor

Amazon FSx is a fast, highly available cloud file system service. Compared to traditional file systems, AWS FSx offers improved performance along with simplified management and security. The use of this service removes the headaches of provisioning hardware and maintaining backups, and combines the familiarity of your preferred filesystems with the reliability of AWS.