Operations | Monitoring | ITSM | DevOps | Cloud

Monitoring

The latest News and Information on Monitoring for Websites, Applications, APIs, Infrastructure, and other technologies.

Handling Sensu Plugin handlers in Sensu Go

In case you missed it, Sensu Go is here! And, as I wrote about previously, one of the hurdles with migrating workloads from the original version of Sensu to Sensu Go are the changes in the internal event data structure. The existing handlers and mutators in the community maintained Sensu Plugins collection might not work as expected in Sensu Go because of these event data model changes. But friends, I’m here to tell you that we’ve got this problem licked.

Healthcare IoT: Monitoring Diabetes with Logz.io

Before I hop right in, it’s important to understand a bit about diabetes. Diabetes is what happens when your body cannot produce (type 1) or respond (type 2) to insulin effectively. The impact on the body is frequently quite severe — people who have difficulty controlling their blood sugar levels run the risk of losing feeling in their fingers and/or toes or even going into a coma if their blood sugar is either too high or too low.

Distrusted Symantec Certificates are Added to SSL Monitoring

Google had announced that Chrome would begin distrusting certificates issued by Symantec Corporation’s PKI and the decision is followed by other major browsers. These are the certificates by Thawte, VeriSign, Equifax, GeoTrust, and RapidSSL that are issued before 1st of December 2017.

2018 Website Outages: Key Lessons from Popular Website Downtime

Now that companies depend on the cloud for access to key services and business operations, downtime has a larger impact on productivity. Uptime is just as critical to small businesses as it is to major ecommerce retailers on Black Friday. Even the public relies on various services like Alexa and email to be available throughout the day. Looking at major outages over the past year provides insight into how companies prepare to handle these events.

Why MSPs Need Application Availability Monitoring

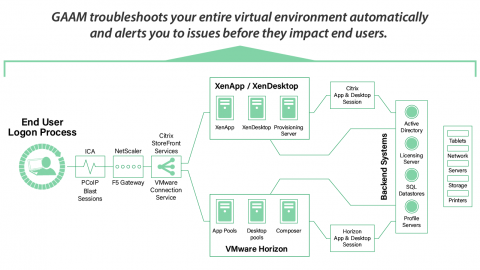
I’ve lived in the virtualization and cloud world for a really long time. During that time, I’ve also seen the impacts on users when you don’t have a good performance monitoring and troubleshooting system in place. That said, what if you have managed services? Do you understand what challenges managed services providers (MSPs) face when working without a monitoring and troubleshooting tool? How are you effectively resolving common VDI performance as well as connectivity issues?

CloudReady Dashboards Tips & Tricks Part #3

This is the third part of a series on the CloudReady dashboards and visualizations. The first part covered basics like Overviews, Refresh, and Layout settings. The second part covered more advanced dashboard usage like layout pinning, capture and embedding. In this third part we’ll cover key widgets, their usage and settings.

Infrastructure UI for Kubernetes and Docker using Elasticsearch and Kibana

The Elastic Stack comes with powerful data visualization capabilities. Filebeat and Metricbeat modules, as well as, Elastic APM ship with pre-built Kibana dashboards that serve as a great starting point for exploring logs, metrics, and APM data in Kibana. On top of that, the Infrastructure, Logs, and APM UIs enable common workflows for correlating the data coming from different operational contexts.

NiCE VMware MP 5.00 Preview Release

Be the first to get a complete picture of the health and performance of your business critical VMware environment using the new NiCE VMware Management Pack. The NiCE VMware Management Pack delivers first-rate monitoring for business critical, highly dynamical virtualized environments. Leverage your existing investment and reduce costs, save time and build efficiencies now.