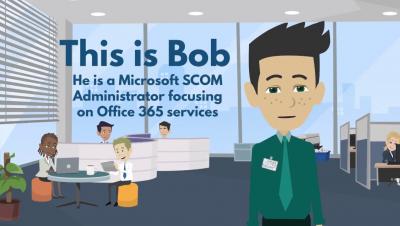
NiCE Active O365 Management Pack Taming The Beast Part1
Office 365 Monitoring made easy | Taming the beast of service outages


The latest News and Information on Monitoring for Websites, Applications, APIs, Infrastructure, and other technologies.
We’ve all been in the situation where suddenly you are the lone developer on call while everyone is out of pocket. Or in the case of Grafana Labs Director of UX David Kaltschmidt, his then business partner, Grafana Labs VP of Product Tom Wilkie, was checking out for a weekend music fest. “Tom and I founded a company a couple of years ago, and I’m more of a frontend person. Tom did all the backend and devops stuff,” explained Kaltschimdt.
Last week I rolled out a simple patch that decimated the response time of a Postgres query crucial to Checkly. It quite literally went from an average of ~100ms with peaks to 1 second to a steady 1ms to 10ms. However, that patch was just the last step of a longer journey. This post details those steps and all the stuff I learned along the way. We'll look at how I analyzed performance issues, tested fixes and how simple Postgres optimizations can have spectacular results.
For eight years, Codemania has brought developers and technology enthusiasts together in Auckland. This year, 500 developers arrived to network, share ideas, and solve problems with an impressive speaker lineup that included developers, authors, and global tech leaders. As the day unfolded, we learned how Apple appears to achieve the impossible with their short product development lifecycles.
The NiCE VMware Management Pack delivers first-rate monitoring for your business critical, highly dynamical virtualized environments. Taming the beast of VMware service outages has never been easier. Leverage your existing investment, reduce costs, save time and build efficiencies that will last beyond your expectations.
The three pillars of observability – monitoring, logging and tracing – are so 2018. At KubeCon + CloudNativeCon EU last week, Grafana Labs VP Product Tom Wilkie and Red Hat Software Engineer Frederic Branczyk, gave a keynote presentation about the future of observability and how this trifecta will evolve in 2019 and the years to come.
Recently, OpenTelemetry has been announced as a new CNCF sandbox project resulting from a merger of OpenTracing and OpenCensus [1], [2], [3], [4]. Several people have already asked me what OpenTelemetry means for the Jaeger project (incubating at CNCF), and whether it is going to replace Jaeger. I will attempt to answer these questions in this post.