Operations | Monitoring | ITSM | DevOps | Cloud

Observability

The latest News and Information on Observabilty for complex systems and related technologies.

Q&A from Our Recent Observability Webinar

Earlier this month I hosted the “Everything You’ve Heard About Observability is Wrong (Almost)” webinar– thanks to all of you who attended. I wanted to follow-up with the attendees as well as those who were not able to join. As promised, it wasn’t the same old Observability presentation that we have grown accustomed to you know, all marketing with little value.

Debugging Just Got Faster and Easier With New Enhancements to BubbleUp

BubbleUp is Honeycomb’s machine-assisted debugging feature and is one of our most powerful differentiators. It leverages machine analysis to cycle through all of the attributes found in billions of rows of telemetry to surface what is in common with problematic data compared to baseline data. This explains the context of anomalous code behavior by surfacing exactly what changed when you don’t know which attributes to examine or index, dramatically accelerating the debugging process.

Where Are You In Your Observability Journey?

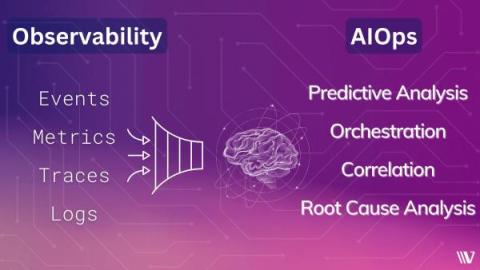
Observability is the ability to see and understand the internal state of a system from its external outputs. Logs, Metrics, and Traces, collectively called observability data, are three external outputs widely considered to be three pillars of observability. Now more than ever, organizations of all sizes must employ the necessary processes and technologies to harness the power of their data and make it more actionable.

Improve Application Reliability With 4T Monitors

StackState’s new 4T Monitors introduce the ability to monitor IT topology as it changes over time. Now your observability processes can trigger alerts on changes in topology that don’t match an ideal state, on deviations in metrics and events and on complex combinations of parameters. Monitoring topology as part of your observability efforts enriches the concept of environment health by adding the dimension of topology.

Authors' Cut-Gear up! Exploring the Broader Observability Ecosystem of Cloud-Native, DevOps, and SRE

You know that old adage about not seeing the forest for the trees? In our Authors’ Cut series, we’ve been looking at the trees that make up the observability forest—among them, CI/CD pipelines, Service Level Objectives, and the Core Analysis Loop. Today, I'd like to step back and take a look at how observability fits into the broader technical and cultural shifts in technology: cloud-native, DevOps, and SRE.

Observability Pipelines: Helping Your Data Do More

With an exploding volume of data and systems comes the need for observability, or the ability to understand the internal states of a system from knowledge of its external outputs. As a result, observability data's importance is at an all-time high. Businesses spanning every industry use it in various ways to respond to issues, increase agility, mitigate risk, and ultimately provide better experiences for their users. It’s an incredibly valuable commodity.

Authors' Cut-Shifting Cultural Gears: How to Show the Business Value of Observability

At Honeycomb, the datastore and query systems that we manage are sociotechnical in nature, meaning the move to observability requires a sociological shift as much as it does a technical one. We've covered the technical part in several prior discussions for our Authors’ Cut series, but the social aspect is a little squishier. Namely: How do you solve the people and culture problems that are necessary in making the shift to adopt observability practices?