Operations | Monitoring | ITSM | DevOps | Cloud
The latest News and Information on Observabilty for complex systems and related technologies.
Apica Acquires LOGIQ.AI to Revolutionize Observability
In the world of observability, having the right amount of data is key. For years Apica has led the way, utilizing synthetic monitoring to evaluate the performance of critical transactions and customer flows, ensuring businesses have important insight and lead time regarding potential issues.
Optimizing cloud resources and cost with APM metadata in Elastic Observability
Application performance monitoring (APM) is much more than capturing and tracking errors and stack traces. Today’s cloud-based businesses deploy applications across various regions and even cloud providers. So, harnessing the power of metadata provided by the Elastic APM agents becomes more critical. Leveraging the metadata, including crucial information like cloud region, provider, and machine type, allows us to track costs across the application stack.
From Disruptions to Resilience: The Role of Splunk Observability in Business Continuity
Reducing Mean Time to Diagnosis: How Salary Finance Uses Honeycomb to Ask the Right Questions
Salary Finance is a UK-based financial well-being employee benefit program. Over the last seven years, the company grew from a startup to a scaleup, earning rave reviews along the way from its more than 4,000 customers. However, with fast growth also comes natural growing pains. As their customer base expanded, so did the number of incidents they experienced, which also became harder to diagnose due to lack of visibility into their increasingly complex environment.
Managing your applications on Amazon ECS EC2-based clusters with Elastic Observability
In previous blogs, we explored how Elastic Observability can help you monitor various AWS services and analyze them effectively: One of the more heavily used AWS container services is Amazon ECS (Elastic Container Service). While there is a trend toward using Fargate to simplify the setup and management of ECS clusters, many users still prefer using Amazon ECS with EC2 instances.
Effective Remote Debugging with VS Code
This post will discuss remote debugging in VS Code and how to improve the remote debugging experience to maximize debugging productivity for developers. Visual Studio Code, or VS Code, is one of the most popular IDEs. Within ten years of its initial release, VS Code has garnered the top spot among popularity indices, and its community is growing steadily. Developers love VS Code not only for its simplicity but also due to its rich ecosystem of extensions, including the support for debugging.
The Evolution of the Service Model In the Data Industry
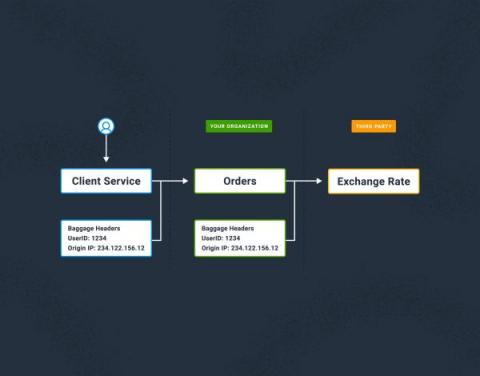
Trace Propagation and Public API Endpoints in .NET: Part 1 (Disable All)
The W3C trace context specification is an amazing standard and a massive leap in standardization of telemetry correlation in the current climate of microservices being the de facto for new systems (that’s a debate for another day).
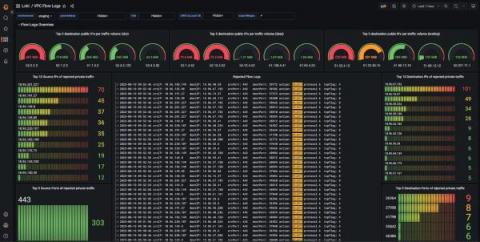
How Qonto used Grafana Loki to build its network observability platform
Christophe is a self-taught engineer from France who specializes in site reliability engineering. He spends most of his time building systems with open-source technologies. In his free time, Christophe enjoys traveling and discovering new cultures, but he would also settle for a good book by the pool with a lemon sorbet.


