Operations | Monitoring | ITSM | DevOps | Cloud
The latest News and Information on Observabilty for complex systems and related technologies.
Lightrun Empowers Developers with Next Generation Metric Tools for Java Performance Troubleshooting
When it comes to debugging performance related issues, the range of these issues together with their root cause can be overwhelming to developers.
Top PostgreSQL Monitoring Tools in 2023
Cribl Stream Projects
Latest Developments in Monitoring and Observability, 2023
You know it’s going to be a great day when you find yourself mentioned as a Sample Vendor on the Gartner® Hype Cycle™ report for Monitoring and Observability, 2023(July 2023). The OnPage team is thrilled to share with its community that we have been mentioned as a Sample Vendor by Gartner on their latest Hype Cycle for Monitoring and Observability. OnPage is recognized as a Sample Vendor, specifically within the Automated Incident Response category.
Continuous Observability: Shedding Light on CI/CD Pipelines
DevOps is not just about operating software in production, but also releasing that software to production. Well-functioning continuous integration/continuous delivery (CI/CD) pipelines are critical for the business, and this calls for quality observability to ensure that Lead Time for Changes is kept short and that broken and flaky pipelines are quickly identified and remediated.
The Evolution of Sampling in Honeycomb: Introducing Refinery 2.0
Honeycomb's Refinery is a tool that customers can use to help manage the volume of their telemetry. It's rare to have too much telemetry—it's not often that someone says "I wish I didn't have all this information!" However, telemetry is data, and data is not necessarily information—particularly when you’re drowning in it. Honeycomb's query engine is so fast and powerful that many customers can send us all their telemetry.
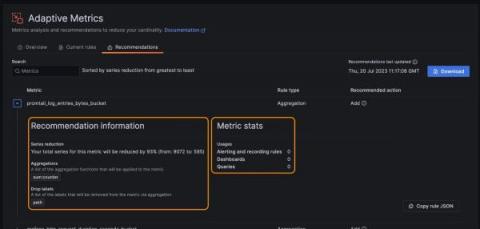
5 steps to start saving on your observability bill with Grafana Cloud Adaptive Metrics
In the observability space, it seems like everyone is talking about how to reduce costs and control the explosion of Prometheus metrics. It’s no wonder — our recent analysis of user environments suggests 20% to 50% of metrics generated are never used, but users are still stuck paying for them.
Enhancing Observability Through Open Telemetry, industry trends and gaps to be considered
Datadog and BigPanda: Observability and AIOps made better together
Datadog’s modern observability empowers development engineers with full-stack visibility, comprehensive instrumentation generation, and proactive alerts to accelerate software development releases and address potential incidents. While Datadog gives teams end-to-end visibility, it works even better together with AIOps from BigPanda – development teams gain insights into outside application dependencies and reliance on other systems.


