Operations | Monitoring | ITSM | DevOps | Cloud

The latest News and Information on Observabilty for complex systems and related technologies.

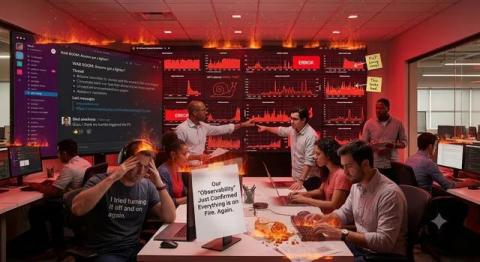
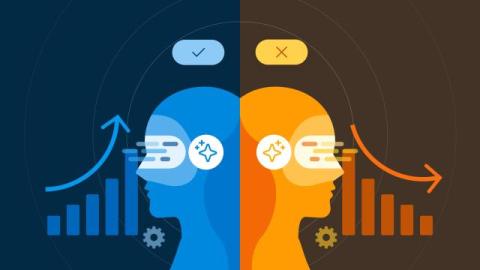
AI is Exposing Observability's Dirty Secret

The 3 pillars of observability are breaking. For years, dev teams relied on Logs, Metrics, and Traces to know when something went wrong. But now? AI agents are writing, deploying, and changing code in real-time. When an AI hallucination pushes a bug to production, standard monitoring sees nothing wrong.To survive the AI era, we need a 4th Pillar of Observability. Watch to find out what it is and why the old way of monitoring just became obsolete.

Shipping Is Your Company's Heartbeat: A Letter from a CTO

The world is especially hard right now. The future of the software engineering profession looks more uncertain than ever. Execs are under heavy pressure to turn AI into magic results, and teams are fighting product competition and AI-induced burnout on one side, melting mental models and hellish oncall on the other side. Observability was supposed to be a solved problem by now.

Lattice Watch: Smarter Guardrails for Design System Observability

One of the hardest challenges facing platform teams is wrangling the rising volume of PRs looking to add drift to the systems we've invested in. It's impossible to catch them all, so it's more important than ever to invest in building stronger guardrails so our product teams can keep building quickly and catch issues before they merge to main. Linters are a great tool to reach for first.

Observability: The Complete Guide (2026)

When something breaks in a distributed system, "is it down?" is the easy question. "Why is it down, and where exactly?" is the one that actually costs engineering teams time. Observability is the practice and the tooling built to answer that second question, and it's become one of the most important disciplines in modern software operations.

Network Observability Tools: Complete Guide for Cloud-Native Applications

Modern IT ecosystems have undergone a profound transformation. Organizations have shifted from monolithic applications running on static infrastructure to highly distributed, cloud-native environments powered by microservices, containers, and Kubernetes. This shift has unlocked unprecedented scalability and agility, but it has also introduced new layers of complexity that traditional monitoring tools were never designed to handle.

What Is Observability 2.0? Meaning, Key Features, and How to Adopt It

How many tools does your team need to answer one question about production? For most enterprise IT teams the honest count is four: a metrics dashboard, a log analyzer, a tracing tool, and the spreadsheet where someone stitches the other three together during an incident. Each of those tools stores its own copy of the truth and sends its own bill.

15 Best AI Observability Tools for Production Teams in 2026

AI applications generate far more than model outputs. Every request includes prompts, retrieval, tool calls, agent steps, latency, token usage, and evaluation signals that all contribute to the final response. When something goes wrong, engineering teams need to understand what happened, why it happened, what it cost, and whether the outcome met quality expectations.

Observability vs. Monitoring for AI Systems

Monitoring tells you when an event you predicted has actually happened. Observability lets you investigate behavior you may not have predicted at all. For most of the past decade, that distinction was something teams could afford to treat as a philosophical debate, because their systems failed in expected ways that had been seen before. A memory leak, a bad deploy, a saturated connection pool. You could build a dashboard and alerts for each and sleep reasonably well.

Multi-Agent Collaboration on a Shared Canvas

This post was co-written with Staff Software Engineer Martin Holman. Honeycomb Canvas is a collaborative investigation environment. When something goes wrong in production, multiple engineers might join the same Canvas to debug it together. Each person has their own AI agent, so they can pursue their own conversation thread and line of inquiry. This creates an opportunity for coordination.

Driving Value from Puppet Metrics: Puppet Observability Data Connector

The Puppet Observability Data Connector is a premium Forge module included with Puppet Enterprise Advanced (PEA). This module provides a deeper dive into your Puppet agent reports. Visualizing these metrics gives you a great way to identify what is healthy and unhealthy in your environment.