InfluxDB Cold Storage
Starting with version 3.0, InfluxDB utilizes two data storage tiers – a hot tier for recent and frequently queried data, and a cold tier for historical data. This approach to cold storage can reduce costs and much more.


In the previous article I covered how to set up auto-instrumented tracing for a Node.js app using OpenTelemetry (OTEL). We then sent the spans directly to the open source tracing tool Jaeger. I recommend you give that a read first before walking through this guide because we're going to re-use the instrumentation we set up last time. Today we're going to take things a step further by introducing the OpenTelemetry Collector.
VIPs can be hard work, but in many ways, that’s for good reason. Whether it’s your C-suite that carries the responsibility of the company on their shoulders, or if it’s your top-shelf customers that form a big part of your business, you really need to look after them all. You know that, but from an IT perspective, how can you not support them while making your life easier? You need to quit being reactive. Easier said than done… but here’s how to start making it happen.
Grafana is a visualization tool that allows you to see and analyze all of your metrics in one unified dashboard. Grafana can pull metrics from any source, display that data, and then enable you to annotate and understand the data directly in the dashboard. Grafana dashboards are designed to allow you to visualize information in a ton of ways, from histograms and heatmaps to world maps. Grafana also has an alerting feature that can communicate with you through Slack, PagerDuty, and more.
You've just made it through a particularly tough incident. It was a short outage affecting a subset of customers, so not exactly the end of the world, but bad enough that it involved multiple people across a number of teams to resolve. Either way, the incident was well managed, and the dust has settled. Now what? Most guidance would say that putting together a post-mortem document is a good idea, given the severity of the incident. You've also done this, so what's next?
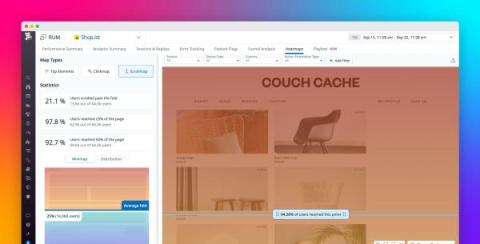
When developing modern applications, product managers, designers, and website developers need to understand how users interact with web pages in order to guide those users through their desired journeys. For example, teams need to know if users ever see the content near the bottom of the page, where to place CTAs to ensure they are in high-traffic areas, and how to compare different pages based on user engagement.
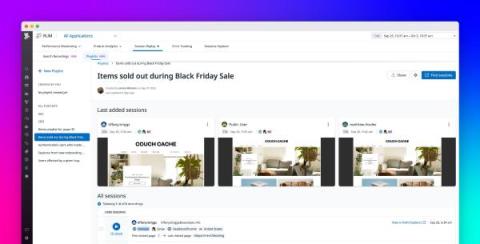
Datadog Session Replay in Real User Monitoring (RUM) enables customers to capture and visually replay the web and mobile experience of their end users. With Session Replay, customers can quickly find and address UX errors by seeing precisely what actions an end user took, the point where they got stuck, and the outcome encountered as a result. Session Replay allows for easier troubleshooting and debugging because it delivers visible, insightful context into frontend errors.