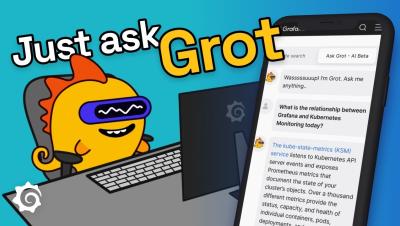
Grafana Labs' new AI-powered chatbot
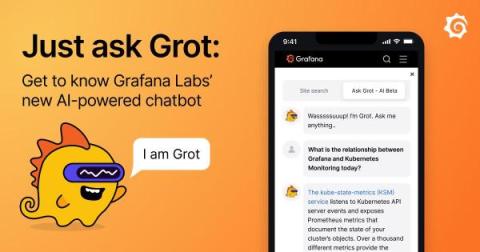
Got questions about Grafana? Just ask Grot, Grafana's new AI-powered chatbot (still in beta). Built in partnership with Pal, a company that creates AI assistants for businesses, and inspired by our bulbous dino mascot, Grot the chatbot has been trained with large language models (LLM) on Grafana Labs’ own content. It can help you easily answer just about any question about our Grafana LGTM Stack, our open and composable hosted Grafana Cloud platform, and more — regardless of how narrow or broad the query might be or what language is set in your browser.