More than half of organizations prioritize security over user experience
Network visibility demands holistic approach to balance user experience with security.


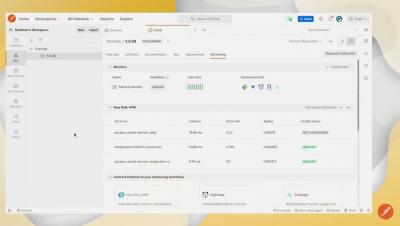
Dashboards allow you to visualize and correlate monitoring data from across disparate data sources, technologies, and infrastructure components to understand what’s going on in your environment. In a growing organization, it’s paramount to standardize how teams build their dashboards to ensure their consistency and legibility.
Earlier this year we introduced the world to Grafana Mimir, a highly scalable open source time series database for Prometheus. One of Mimir’s guarantees is 100% compatibility with PromQL, which it achieves by reusing the Prometheus PromQL engine. However, the execution of a query in the Prometheus PromQL engine is only performed in a single thread, so no matter how many CPU cores you throw at it, it will only ever use one core to run a single query.