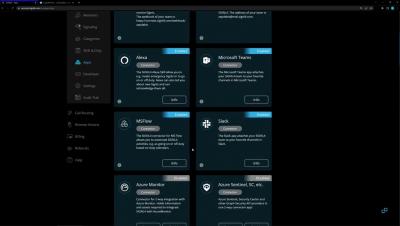
Creating a 2-way connection between SIGNL4 and Logic Monitor
A walkthrough of using the SIGNL4 connector to connect to Logic Monitor for 2 way connectivity.


Microservices have grown to become one of the most optimal alternatives to monoliths. However, just building your app and releasing it to the public isn’t everything. Monitoring microservices is as important as building and releasing them. You need to maintain it to resolve issues that may occur and also introduce new features from time to time.
We’re excited to share new Splunk capabilities to help measure how code performance impacts your services. Splunk APM’s AlwaysOn Profiling now supports.NET and Node.js applications for CPU profiling, and Java applications for memory profiling. AlwaysOn Profiling gives app developers and service owners code level visibility into resource bottlenecks by continuously profiling service performance, at minimal overhead.
Achieving cost savings is one of the main drivers for cloud adoption. But for most companies, controlling cloud spend is much more challenging than anticipated. In a recent survey, 94% of IT decision makers report they are overspending in the cloud. Our own survey on cloud costs revealed 90% of executives say better cloud cost management and cost reduction is a top priority.
I was hosting my regular monthly Business Office Hours a few weeks ago and the following question was posed by one of my partners: “Do you have any collateral or talking points I can use to help persuade my break/fix customers to move over to managed services?”
As in any high-growth environment, expanding your suite of products and capabilities can contribute to a growing backlog of errors, and challenges prioritizing them… a scenario not lost on the team at Airtable, a connected apps platform that more than 300k organizations, including 80% of the Fortune 100, rely on to connect their teams, data, and workflows. To support organizations like Amazon and IBM, Airtable ships new features and updates through multiple deployments a week.