
Operations | Monitoring | ITSM | DevOps | Cloud

OpenClaw Monitoring & Observability with OpenTelemetry and SigNoz

Learn how to implement monitoring and observability for OpenClaw systems using OpenTelemetry and SigNoz. In this video, we cover how to instrument OpenClaw, collect traces, metrics, and logs, and visualize everything in SigNoz for real-time insights into performance and reliability. You’ll see how to quickly identify bottlenecks, debug issues, and improve system stability in production.
Claude Agent SDK Monitoring & Observability with OpenTelemetry and SigNoz

Learn how to implement monitoring and observability for the Claude Agent SDK using OpenTelemetry and SigNoz. In this video, we walk through instrumenting your Claude-based agents, capturing traces, metrics, and logs, and visualizing everything in SigNoz for real-time insights. You’ll learn how to debug agent behavior, identify latency bottlenecks, and monitor performance in production environments.

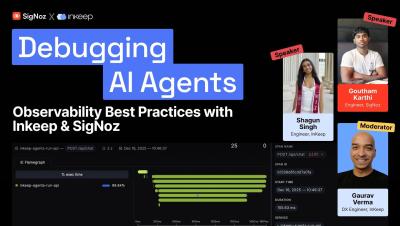
Debugging AI Agents in Production Without Losing Your Mind

AI agents are powerful, but debugging them in production is hard. Non-deterministic behavior, LLM latency, and token costs create observability challenges that traditional monitoring tools don't address. In this webinar, engineers from Inkeep and SigNoz walk through how Inkeep monitors its AI agent framework in production using OpenTelemetry-native observability.

What is OTLP and How It Works Behind the Scenes

If you have worked with observability tools in the last decade, you have likely managed, and been burnt by, a fragmented collection of tools and libraries. Each observability signal required its own tool, data formats were incompatible and had little or no correlation. For example, log records would not link to traces, meaning you had to guess which traces led to which events. The OpenTelemetry Protocol (OTLP) solves this by decoupling how telemetry is generated from where it is analyzed.

OpenTelemetry Collector Contrib - A Hands-on Guide

As application systems grow more complex, it becomes ever more important to understand how services interact across distributed systems. Observability sheds light on the behavior of instrumented applications and the infrastructure they run on. This enables engineering teams to gain better track system health and prevent critical failures. OpenTelemetry (OTel) has standardized how we generate and transmit telemetry, and the OpenTelemetry Collector is the engine that processes and export this data.

Reducing OpenTelemetry Bundle Size in Browser Frontend

When I was building applications, I used to always rely on the DevTools console of my web browser to examine logs in the frontend. But, with UI log messages only being accessible within your browser rather than forwarded to a file somewhere, which is the common pattern with backend services, losing visibility of this resource when triaging user issues was a real dilemma.

OpenTelemetry Agents - The Complete Beginner's Guide (2025)

If you search for “OpenTelemetry Agent”, you will likely encounter two completely different definitions. This ambiguity often leads to confusion between infrastructure teams and application developers. SREs and DevOps engineers would describe it as a component deployed as a sidecar, whereas application developers would understand it as a language-specific library. Let’s break it down in the next section.

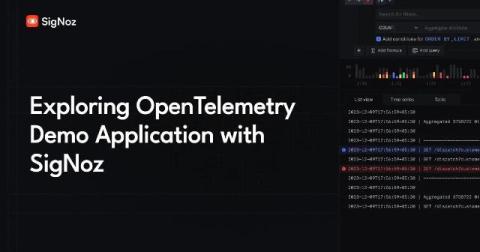
Setup and Explore OpenTelemetry Demo Application (with Examples)

Everyone knows that debugging is twice as hard as writing a program in the first place. So, if you’re as clever as you can be when you write it, how will you ever debug it? — Brian W. Kernighan and P. J. Plauge, The Elements of Programming Style, 2nd ed. Maybe you can let SigNoz do some heavy lifting for you!

OpenTelemetry Metrics with 5 Practical Examples

Picture this, your observability tool already nails the basics like request rates, latency and memory usage, but you need more insight. Think user churn rates, engagement spikes, or even how many carts get abandoned mid-checkout. That’s where OpenTelemetry steps in, providing a way to track those critical custom metrics with ease.