Operations | Monitoring | ITSM | DevOps | Cloud

%term

Having a "Secure Network" or "Secure Devices" Isn't Enough Anymore. So, What Is?

There’s this notion that a secure network of devices is not good enough…that what you need is a network of secure devices. However, at Zebra, we believe the only thing that’s acceptable these days is a secure network of secure devices. That’s why we’re working with Google Cloud and Qualcomm Technologies, Inc. to look deep into on-prem and cloud architectures to implement the best security features at every potential access point.

Product Release Notes October 2024

The easier it is for you to get data into CloudZero, the easier it’ll be to maximize your cloud efficiency. This month’s updates have entirely to do with ease of use: a drag-and-drop method to get unit cost metric data into the product, an improved MongoDB integration, and continued improvements to our AnyCost API and cost integrations.

3 Reasons Why This Startup Migrated From Clever Cloud to Scaleway Kapsule

Making infrastructure decisions can feel like a high-stakes puzzle: finding the right balance between technical capabilities, cost efficiency, and ease of management is no small feat. Recently, a company switched from Clever Cloud to Scaleway Kapsule (Kubernetes), with Qovery orchestrating its transition. Here’s what drove this change and how it’s paid off.

Checkly Changelog: New Features and Updates - Traces, Visual Regression Checks, and Degraded States

Join María and Nočnica as we go over three major new features from Checkly: Checkly Traces - integrate OpenTelemetry data from your stack with synthetic monitoring traces Visual Regression Checks - Check for pixel-by-pixel changes to your website Degraded Checks - want to note a problem but don't want it to trigger alerts like a failing check? Try soft assertions and the 'degraded' state.

Network Observability: Mastering Infrastructure Data for Smarter IT

If you want to know exactly what’s on your network and how it’s all connected in real time, then network observability is the answer. Network observability pulls data from sources across your network infrastructure to model a detailed view of your systems and how they interact. This lets you understand exactly what’s happening on your network at any given moment so you can optimize performance.

Understanding IoT Logging Formats in Azure and AWS

Internet of Things (IoT) devices are everywhere you look. From the smartwatch on your wrist to the security cameras protecting your offices, connected IoT devices transmit all kinds of data. However, these compact devices are different from the other technologies your organization uses. Unlike traditional devices, IoT devices lack a standardized set of security capabilities, making them easier for attackers to exploit.

DevOps Security Best Practices: 2025 Guide

Is your DevOps security ready for cyber threats? Embrace these best practices and make security your competitive advantage. DevOps, a set of practices that combines software development (Dev) and IT operations (Ops), has revolutionized the way organizations build, deploy, and maintain software. With the rise of cloud computing, there was a need for faster and more reliable software delivery than traditional software development methodologies allowed. DevOps was the natural evolution.

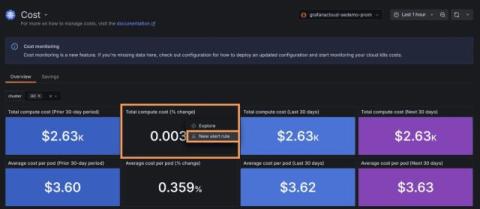
Creating alerts from panels in Kubernetes Monitoring: an overlooked, powerhouse feature

As a product manager here at Grafana Labs, I’ve learned that sometimes the most powerful features can sneak by unnoticed, buried in those three little dots off to the side of the panel. But what happens when one of those hidden gems suddenly becomes the star of the show? Recently, we released a new Kubernetes Monitoring feature in Grafana Cloud—an alert system you can use to create alerts from panels in the app.

Observability as a superpower

With every job I have, I come across a new observability tool that I can’t live without. It’s also something that’s a superpower for us at incident.io: we often detect bugs faster than our customers can report them to us. A couple of jobs ago, that was Prometheus. In my previous job, it was the fact that we retained all of our logs for 30 days, and had them available to search using the Elastic stack (back then, the ELK stack: Elasticsearch, Logstash, and Kibana).