Operations | Monitoring | ITSM | DevOps | Cloud

The Best Production Monitoring Tools & Software For 2022

As a software engineer running applications in production, it is essential to monitor this environment to maintain the health of your applications. Production monitoring software and systems are used to improve observability so that you can better understand your operating environment and visualise performance issues easily.

All You Need To Know About Multi-Cloud Security

A recent study from Juniper Research predicts the value of enterprise cybersecurity spend will continue to climb, exceeding $226 billion in 2027; up from $179 billion in 2022. This growth of 26% over the next five years reflects a rising awareness of vulnerabilities, not least of which is DDoS (Distributed Denial of Service) as a key driver behind the increasing spend.

GrafanaCONline 2022 Day 4 recap: Grafana Labs technical docs, citizen science with Grafana Cloud, load testing with Grafana k6, and more

GrafanaCONline 2022 wrapped up on Friday, and the big finish featured sessions that covered important changes in Grafana Labs technical documentation, Grafana Cloud’s role in activist engineering projects, and the benefits of load testing with k6. There was also a great success story out of East Africa, where a major bank switched to a business monitoring system with Grafana and improved its customer satisfaction and revenue.

Kubernetes Annual Report 2021: What you need to know

The Cloud Native Computing Foundation published their Annual Report for 2021 which outlines the past year and what can be expected in the upcoming 6 months. Community leaders and 62,000 contributors on GitHub came together to report on initiatives and updates to create CNCF’s second annual report. So, here are the important updates from the Kubernetes Annual Report that we think you need to know.

Integrate with AppDynamics | Moogsoft Product Videos & How-Tos

After watching this video, you will be able to set up a template in AppDynamics to send data to Moogsoft, configure a JSON payload to map AppDynamics data to Moogsoft event fields, and define an AppDynamics policy to forward health rule violations and other issues to Moogsoft.

Observation Is More than Monitoring | Discovering Observability: Session 2

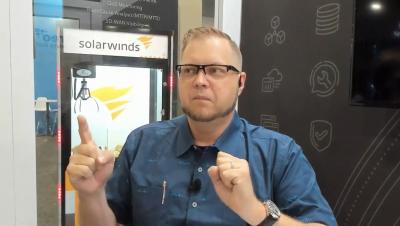
You’re ready to take the leap and move your existing Orion Platform infrastructure to Hybrid Cloud Observability, but we know you’ll have questions. So, we’ve put together some people who can answer these questions in a way that’s easily digestible for current Orion Platform users.

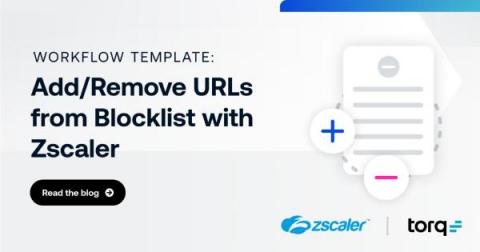
Automatically Update URL Blocklists in Zscaler Using Torq

Blocking access to certain URLs is a simple, effective strategy for protecting users and the network. But, in a world where new and increasingly sophisticated scams seem to appear almost weekly, the task of maintaining that list can become overly burdensome when performed manually. Torq offers a number of ways to automate URL blocklist management, reducing manual effort and speeding up response to new threats.

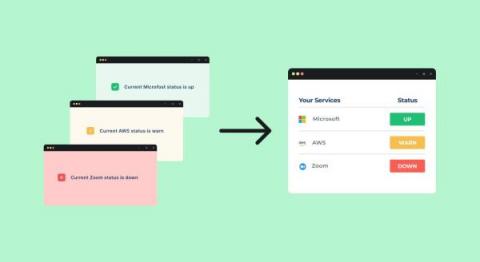
Status page aggregation: How to aggregate status pages?

If you’re managing IT or infrastructure these days, you almost certainly depend on dozens of hosted services or cloud applications. From major cloud services like Amazon, Azure, or Google, to customer service tools and marketing platforms, your business depends on the uptime of others. Each of these services publishes a status page where they warn about maintenance, outages, and performance issues but can you keep track of all of those at the same time?