Operations | Monitoring | ITSM | DevOps | Cloud

%term

Sending Your VMWare vSphere Logs to LogDNA

Logging your virtual machines (VMs) is important, but what’s even more important is logging the hypervisors that run them. Hypervisors generate extremely useful data about the operation of your virtual machines and the environments that they run in. While VMs provide some information about their state, details such as VM performance, changes in state, errors, and security can only be found through hypervisor logs.

The Future of Serverless is ... Functionless?

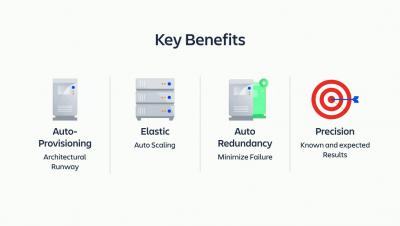
I’m in a position where I converse with our customers and cloud service providers, and I keep track of conversations happening through blogs and social media. I then sift through all this data to identify patterns and trends. Lately, I’ve seen some talk about an architectural pattern that I believe will become prevalent in the near future.

Collect Google Stackdriver logs with Datadog

Google Cloud’s Stackdriver Logging is a managed service that centralizes and stores logs from your Google Cloud Platform services and applications. We are excited to announce that Datadog’s GCP integration now includes Stackdriver Logging. You can collect all your GCP logs using Datadog so you can search, filter, analyze, and alert on them along with your metrics and distributed request traces in a single platform.

What's New in Elastic Stack 6.7

In the midst of all the turmoil and debate around Open Distro for Elasticsearch, Elastic continues to produce, and last week announced both a new major release of the Elastic Stack — version 6.7 (and also the first release candidate for 7.0!). As usual, I’ve put together a brief overview of the main features introduced. One change I’ve applied this time is adding a comment for each feature detailing what license it falls under.

Is Uptime.com the Right Nagios Core Alternative for You?

Uptime.com and the Nagios monitoring tool serve similar functionality from a surface view. Both alert users to downtime, both offer extensive notification options, and both maintain an API for a variety of flexible use cases. However, these surface distinctions are the extent of the similarities between the two. Nagios Core and Uptime.com serve very different user types, and offer different benefits. You can think of Nagios as your internal safeguard, and there are some challenges to scaling.

Automating Building the Grafana Image on DigitalOcean with Packer

I recently gave a talk at DigitalOcean Tide in Bangalore on “Grafana and the DigitalOcean Marketplace.” The DO Marketplace lets you launch a range of open source software, including Grafana, with just a few clicks. This post is not about the marketplace – I’m going to talk about how we automated the building of the images.

DevOps Starts by Knowing Your Numbers

If you want your DevOps initiative to take off, be prepared to provide some metrics! IT organizations that can't quantify their risk factors and exposure are likely to make investments in DevOps where it doesn’t matter. After working with several teams that lost their support for DevOps after making automation investments in areas that weren't important, Anne Hungate's “Know Your Numbers” model emerged.

Your Journey to Cloud-Native Begins with DevOps, Microservices, and Containers

Everyone is excited about cloud-native applications. And for good reason! They're scalable, resilient, portable across cloud environments, and make it easier to incorporate customer feedback quickly. But there's a catch: cloud-native applications fundamentally change the way you provision, deploy, and manage your infrastructure.

After Agile, DevOps, and Lean IT: Modern Methodology in the Age of Disruption

In an age of disruption, increasingly complex and chaotic problems demand emergent or completely novel practices. Decades-old practices no longer work, raising difficult questions about the role of management in a world being disrupted by technology.