Operations | Monitoring | ITSM | DevOps | Cloud
%term
Increase customer satisfaction by solving issues faster
Serverless vs. Containers
We live in exciting and worrying times. In serverless and containers, we have two amazing technologies that provide productive, machine-agnostic abstractions for engineers to work with. And yet, there seems to be an unbridgeable chasm between the two camps. If you have read anything I wrote in the last two years, you know that I am firmly in the serverless camp. But I was also an early adopter of containers.
More Packs, More Fixes
Time for another roundup of recent StackStorm Exchange pack updates. It’s easy to miss the new packs and updates to old ones. This month it’s Bolt, Backups, Slack, Jenkins and more. Read on for details.
Reduce Hosting Costs: Application Dependency Performance Tuning
You were sold the promise of the cloud. The performance gains were going to make everything better. Costs would go down since you’d only be paying for the resources you were actually using. It sounded magical. You’d look like a star and save your company money. Unfortunately, when all was said and done, the cloud didn’t deliver.
Coralogix
3 Reasons to Ditch Flat On-Call Structures For Escalation Layers
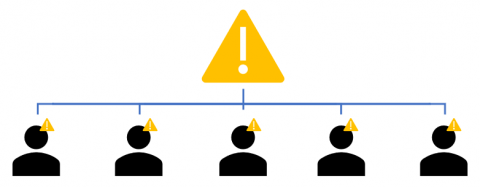
What’s A Flat On-Call Structure? A flat on-call structure is an on-call schedule that has multiple people getting notified of the same incident at the same time. There’s no escalations, no hierarchy, no layers.
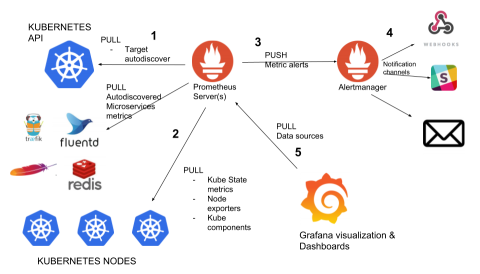
Kubernetes Monitoring with Prometheus -The ultimate guide (part 1).
Prometheus monitoring is fast becoming one of the Docker and Kubernetes monitoring tool to use. This guide explains how to implement Kubernetes monitoring with Prometheus. You will learn how to deploy Prometheus server, metrics exporters, setup kube-state-metrics, pull, scrape and collect metrics, configure alerts with Alertmanager and dashboards with Grafana.
OpsGenie Mobile App Tour
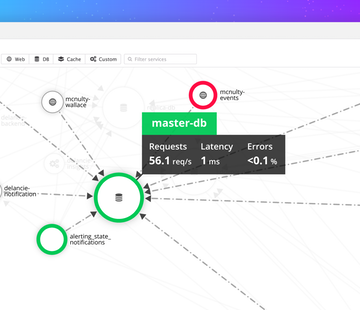
Introducing the Service Map in Datadog
When your pager goes off at 3:00 a.m. and you need to begin your investigation, where do you start? Before you can attack the problem, you need to know the lay of the land: What else is potentially affected by this failing service? What are its dependencies? Where are the probable root causes? With the new Datadog Service Map, you can visualize the topology of your application to answer these questions and more.


