
Operations | Monitoring | ITSM | DevOps | Cloud

Building Production-ready AI Infrastructure? Start With the Network

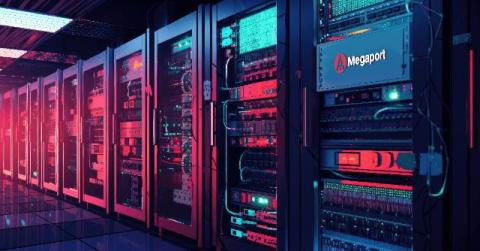
AI workloads depend on fast, secure, and scalable access to data across on-premises systems, colocation, cloud platforms, and GPU environments. Here’s how private connectivity can help enterprises move from AI proof of concept to production-ready infrastructure. AI pilots tend to be forgiving. Production isn’t. In the early stages, a team can usually get by with a simple path into a GPU environment, enough bandwidth to test an idea, and a security model that suits a limited group of users.

Why engineers ignore cloud cost governance (and fixes)

Discover why engineers ignore cloud cost governance and how to build developer cost accountability. Learn how Harness helps empower engineering teams. Engineers often overlook cloud costs due to friction in traditional FinOps tools and a lack of real-time visibility. By embedding automated guardrails and shift-left cost insights into developer workflows, organizations can drive accountability without slowing velocity.

AI Control Tower Live: Governance that moves at machine speed

One question, ninety minutes: Do you know what AI agents you have running, what they're accessing, and what's their ROI? ServiceNow product leaders open with an overview of why legacy controls can't keep pace with AI agents. Then we'll showcase customer stories from Zespri and Booking.com, end-to-end demos of AI Control Tower, and a look inside ServiceNow's own AI estate.

Seer, the Sentry MCP and CLI, or your own coding agent: where each one fits

I’ve been getting some version of this question a lot lately, mostly in our Seer preview webinars. Different audiences, same handful of questions: Worth answering all three in one place. Honestly, I needed to write this down for myself too. Things are moving fast around all of us and answers seem to get more nuanced by the week. This is an attempt to codify the difference: what each option is and when it makes sense to reach for one over the other.

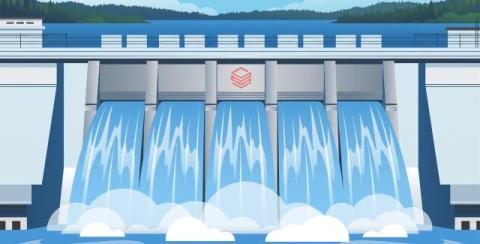
Databricks' native monitoring resources

In the first part of this series, we cataloged key metrics for Databricks data engineering, analytics, and Model Serving workloads. In this post, we’ll discuss how to collect those metrics and other telemetry data from Databricks and Apache Spark, which powers Databricks under the hood. We’ll cover collecting and querying telemetry data via system tables, as well as the other primary sources of visibility into.

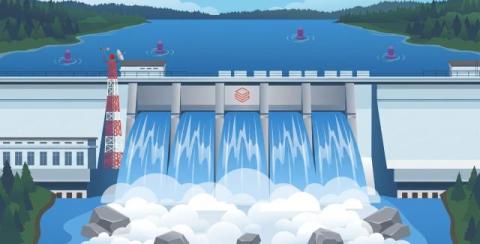
Monitor Databricks with Datadog

Earlier in this series, we covered key metrics for monitoring performance in Databricks and discussed Databricks’ native resources for accessing those metrics and other key observability data, such as logs and data lineage. In this post, we’ll cover using the Databricks integration to bring that data into Datadog and monitor your Databricks analytics and AI/ML workloads alongside the rest of your end-to-end data pipelines and distributed infrastructure. We’ll show you how to.