This video gives a demonstration of the Network Traffic Analysis Plus (NTA+) functionality within WhatsUp Gold. Find more information on Network Traffic Analysis.
Get the latest insights from our 2025 report, learn new approaches for professional development and gain valuable knowledge to stay ahead in your career. In this video, you'll hear from our speakers Kellyn Gorman, Steve Jones, and Mri Pandit. Since 2017, Redgate has surveyed thousands of global practitioners each year to examine how our industry is changing, and provide advice and guidance for organizations and database professionals alike.
In this episode, the pair discuss a new article from Phil Factor that drills into the basics of how to compare databases and generate schema models and migration scripts using Flyway Enterprise CLI.
Essential Browser Security Updates You Need to Know Browsers are vulnerable and need regular updates to stay secure. Organizations are focusing on multiple remediation strategies and recommend weekly updates. Recent updates from Apple tackle a USB vulnerability in iPhones and iPads that could allow unauthorized access, posing a significant risk to high-profile users and their sensitive information.
Some IoT companies are making money; others are leaking it. Margins in IoT are already tight, but many brands are losing cash in ways that are completely preventable. RMAs, bloated customer support costs, churn, and on-site technician visits all add up. Too many companies default to replacing hardware instead of fixing the code. Without OTA updates and remote diagnostics, budgets get drained by unnecessary shipping and support costs.
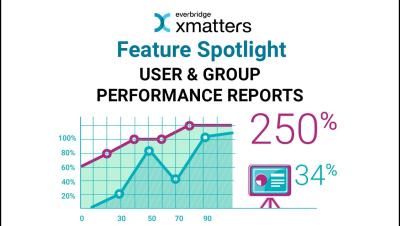
Understanding how groups and users respond to incidents is vital to refining and improving your incident response processes. Our user and group performance reports help admins visualize the way people in their organization handle notifications for alerts and incidents. These reports can be used to review performance data over a specific amount of time, allowing you to clearly analyze trends and changes, and identify groups that may be inundated with alerts, or users who may not be available when expected.
Modern network management requires administrators to gather information about live network performance, detect faults as they are happening, and provide assurance of overall operations. Simple Network Management Protocol (SNMP) is a protocol commonly implemented for monitoring network infrastructure that satisfies each requirement.
Every new layer of infrastructure piles onto an already fragile web of interconnected challenges, making it painfully clear: traditional monitoring can’t keep up. You’re drowning in alerts, buried in data, and yet somehow still flying blind when real issues arise. More notifications don’t mean more insight, and more data doesn’t guarantee better decisions.
Cloud storage is an alternative to storing files and data on physical devices. It allows for the easy and convenient storage of digital data on external servers. Cloud storage allows users and organizations to store, access, and manage data without owning or operating their own data centers. Due to its affordability, ease of use, and scalability, cloud storage is the most popular method for managing data.
If you're looking for a straightforward way to collect NGINX metrics via OpenTelemetry and send them to your Graphite-based monitoring setup, this article is for you! With minimal configuration you’ll be collecting key metrics from your NGINX connections within minutes. In this article, we'll explain how to install the OpenTelemetry Collector, and easily configure it to receive and export NGINX metrics to a Hosted Carbon endpoint.