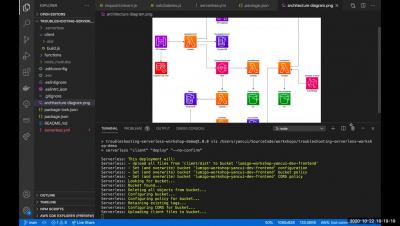
Operations | Monitoring | ITSM | DevOps | Cloud

Puppet's path to IPO and welcome to our new board members

We’ve had an exciting year here at Puppet, and although it’s not the year we could have expected, I’m encouraged and inspired every day by the resilience of our team, our commitment to each other, and our drive to help customers navigate through so much uncertainty and change.

How Netdata gets you from 0 to monitoring in minutes

Netdata is zero-configuration monitoring. It’s a principle that we’ve stood behind since the project’s beginning, when it was only our CEO Costa trying to solve a “painful, real-world problem,” and it’s one we stand by today. Our insistence on zero-configuration guides every product decision we make, every grooming process, and every React component our frontend teams design.

Welcome to Netdata's community repository: Consul, Ansible, ML

On our journey to democratize monitoring, we are proud to have open source at the core of both our products and our company values. What started as a project out of frustration for lack of existing alternatives (see anger-driven development), quickly became one of the most starred open-source projects on all of GitHub.

An Introduction to our New Product: Logz.io Distributed Tracing

Yesterday we were excited to announce Logz.io Distributed Tracing, the most recent addition to our Cloud-Native Observability Platform. This is such a special launch for us because it makes Logz.io the only place where engineers can use the best open source monitoring tools for logs, metrics, and traces – known as the ‘three pillars’ to observability – together in one place.

Why modern testing requires Chaos Engineering

Modern applications are changing, and traditional testing practices are no longer up to the task. Learn more about the changing landscape of QA and how Chaos Engineering provides the necessary framework for testing modern applications. Chaos and Reliability Engineering techniques are quickly gaining traction as essential disciplines to building reliable applications. Many organizations have embraced Chaos Engineering over the last few years.

Barbara Nelson | How Can I Put That Dashboard in My App? | InfluxDays

Many users love using the InfluxDB UI to visualize their time series data in a variety of different graphical representations. In this session, Barbara Nelson will show how to use Giraffe (the React-based visualization library powering the data visualizations in InfluxDB 2.0 UI) to visualize your time series data within your own app. You can bring the power of our visualization tools to your users, directly in your app, instead of requiring them to login to the InfluxDB UI to see a visual representation of your data.