Operations | Monitoring | ITSM | DevOps | Cloud

January 2025

The problem with traditional log management

Logs are everywhere and contain valuable information that can make or break everything from security investigations to avoiding an outage, but legacy log management systems are inefficient for modern organizations generating more data than ever before. Sr. Director of Technical Marketing Adam White offers guidance on the pitfalls of traditional log management and what your organization can do today to jumpstart your digital transformation journey!

The power of cloud native observability

Unstructured data clouding your observability goals? Learn why monitoring alone cannot solve business-critical performance issues as Sr. Director of Technical Marketing Adam White explains how combining structured and unstructured data with real-time analytics unlocks dynamic insights into root cause analysis and performance management in the cloud.

Micro Lesson: Introduction to Sumo Logic Mo Copilot

The video introduces Sumo Logic's Mo Copilot, an AI-powered assistant that simplifies complex query creation using natural language, making it accessible for users of all skill levels. Mo Copilot enhances productivity by providing AI-driven insights and recommendations, allowing teams to detect and resolve incidents more efficiently. It consolidates logs into a unified view, improving collaboration and decision-making. Overall, Mo Copilot transforms the way security and development teams work with data.

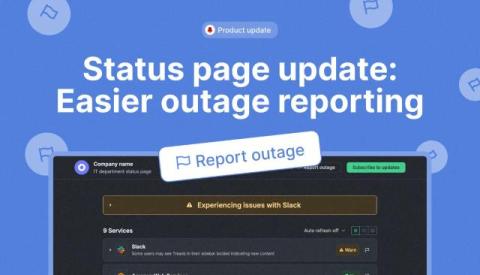
Status page update: Easier outage reporting

We’ve added a “Report Outage” button at the top of the StatusGator status page to make reporting issues even easier. Your outage reports play a key role in keeping our status page accurate and are a valuable part of the data we use for features like Early Warning Signals, which help spot potential disruptions before they’re officially acknowledged.

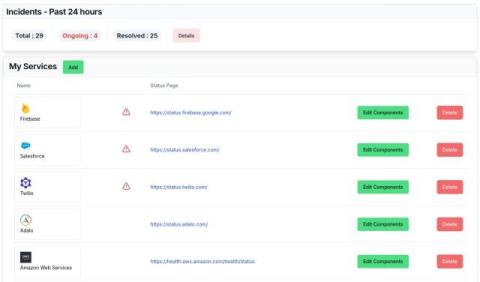
January 2025 Product Update - Easier Onboarding, Better User Experience, and Reliability Improvements

For the last two months, we have focused on improving the onboarding experience for users so that they can get started with monitoring with minimal effort. We have also added several improvements in the backend to make the service more robust and reliable. Some of the usability improvements are driven by user feedback. Others incorporate what we would personally like to see in such a monitoring service. We have also improved the dashboard user experience.

Data Clean Rooms and CDP: Everything Brands Need To Know

The global Customer Data Platform (CDP) market, expected to cross $28 billion by 2028 with a CAGR of 39.9%, highlights the growing dependence on data-driven marketing strategies. As the cornerstone of modern marketing, CDPs have become indispensable for businesses seeking to harness the power of their customer data. CDPs help build a unified customer view that enables businesses to personalize campaigns for seamless engagement across marketing channels.

The Power of Evidence Collection and Release Lifecycle Management

The speed of today’s software development lifecycle is only getting faster. However, the complexity of today’s pipelines make it hard to track and manage the processes software releases must go through. With increasing regulatory pressures, ensuring and proving your software has gone through the necessary quality controls is no longer nice to have – it has become a necessity.

Grafana 11.5 release: easily share Grafana dashboards and panels, secure frontend code for plugins, and more

New year, new Grafana release! Grafana 11.5 is here with new features to enhance how you can share, migrate, and alert on all your data in Grafana. Grafana 11.5: Download now Below are just some of the highlights from the latest Grafana release. If you are looking for more details about all the changes in this release, refer to the changelog or the What’s New documentation.

Global data mesh for public sector organizations

The sheer volume of data, often siloed and lacking interoperability, can make it challenging to get a big-picture, accurate view across complex public sector environments. With a global data mesh, you gain fast access to all potentially relevant information, regardless of source, format, or location.

Getting the Most Out of Java With SolarWinds Loggly

Logs are a developer’s first line of defense when monitoring and troubleshooting distributed applications. They provide insights into performance, user behavior, and application stability, whether your application is written in Java or another language. However, when your applications scale up, and you have fragmented log data scattered across different systems, this will complicate your troubleshooting effort. This is what makes a centralized logging tool like SolarWinds Loggly essential.