Operations | Monitoring | ITSM | DevOps | Cloud

January 2025

The importance of error budgets for SREs and how to monitor them

Digital-first customers who are always on the go expect a seamless experience. But let’s face it—100% uptime is a myth. Trying to achieve it can drain resources and stifle innovation. This is where error budgets come in. They help site reliability engineers (SREs) find the sweet spot between delivering reliability and development velocity. With error budgets, teams can focus on building a robust system without burning out over perfection.

Finding Your Way: Using Metrics to Explore Organizational Architecture

Imagine being the new developer in a bustling tech company. Everyone is rushing to meet deadlines, and no one has time to explain the tangled web of services, databases, and messaging systems that make up the organization’s architecture. You search high and low for documentation, but the few diagrams you find are outdated or incomplete. Feeling lost? This is where metrics can come to the rescue.

Managing External-DNS & cert-manager with Komodor

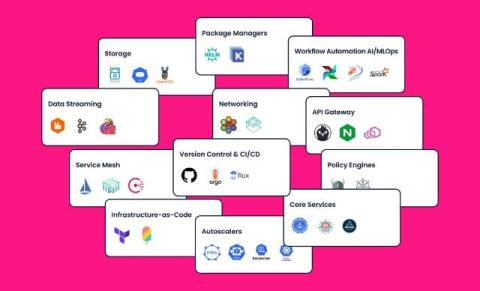
Recently we’ve explored the evolving role of Kubernetes as a full ecosystem, rather than just a platform, diving into the power and complexity of add-ons. These tools, as highlighted previously, are key to augmenting Kubernetes core capabilities, and adding-on (as their name implies) essential capabilities not supported directly by Kubernetes itself.

What is synthetic monitoring?

Synthetic monitoring proactively assesses application performance, allowing us to detect potential issues before they impact users. When combined with tracing, it becomes more effective by linking synthetic tests to actual system traces. This integration offers deeper visibility and granular insights into application behavior, enabling more effective, data-driven decisions to optimize performance.

Create a Splunk pipeline to filter, mask, and route logs - without SPL2

In this video, we will take a look at how you can create a Splunk Data Management pipeline to filter, mask and route your logs with using any SPL2 code. For this demo we have used Ingest Processor to build our pipeline but the same concept can be used for Edge Processor as well.

Pod Exec in K8s: Advanced Exec Scenarios and Best Practices

Remember using SSH to access servers? It was the go-to method for troubleshooting or making changes to a system. But in the world of containers, SSH doesn't quite fit. Kubernetes and containers work differently; they're dynamic and spun up and down frequently. That’s where kubectl exec comes in. It lets you run commands inside a pod directly, without needing to rely on SSH or worry about the pod being ephemeral. It’s simple and fits the nature of modern, containerized environments.

OpenMetrics vs OpenTelemetry: A Detailed Comparison

When it comes to monitoring and observability, two of the most discussed standards are OpenMetrics and OpenTelemetry. While both are designed to collect and transmit metrics, they have distinct goals, use cases, and communities driving their development. In this guide, we'll break down what each of these projects is, how they compare, and how they fit into your monitoring stack.

Kubernetes Pods vs Nodes: What Sets Them Apart

Kubernetes has revolutionized how we manage containerized applications, bringing scalability, reliability, and flexibility to the forefront. Two fundamental components of Kubernetes are Pods and Nodes, and understanding their differences is crucial for anyone working with Kubernetes clusters. While most people are familiar with these terms, a deeper dive into the specifics can help you optimize your Kubernetes setup and avoid common pitfalls.

How to get more value from your cloud commitments

If you are familiar with the cloud, you already know that the big hyperscalers offer a set of pricing models that provide varying levels of flexibility and discounts. The most common models are On-Demand (OD), Commitments—such as Reserved Instances (RI), Savings Plans (SP), Committed Use Discounts (CUD), and preemptive instances like spot instances/spot VMs.

This Month in Datadog - January 2025

On the January episode of This Month in Datadog, join Jeremy Garcia (VP of Technical Community and Open Source) and Daljeet Sandu (Product Manager) for a bonus video that spotlights Datadog On-Call, which is now generally available. Also featured is a roundup of new features that Datadog recently announced. This Month in Datadog is a monthly update of the company’s latest features, product announcements, and more. Subscribe to our YouTube channel to get notifications about future episodes.

What's new with Microsoft Azure for 2025

Microsoft Azure remains the second largest cloud service provider with 24% of the market share globally but boasts the most availability zones, spanning 60+ regions worldwide. Over the past 12 months, the platform has seen major advancements across AI and infrastructure, and we share some of the highlights in this blog.