Operations | Monitoring | ITSM | DevOps | Cloud

Latest Posts

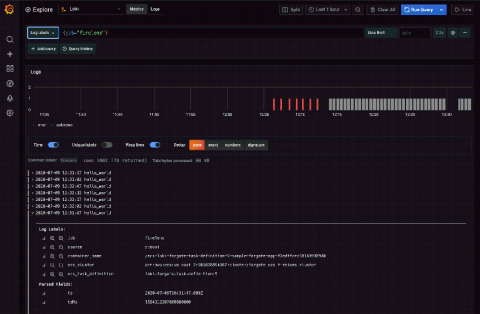
Loki tutorial: How to send logs from Amazon's ECS to Loki

Elastic Container Service (ECS) is the fully managed container orchestration service by Amazon. Combined with Fargate, Amazon’s serverless compute engine for containers, you can run your container workload without the need to provision your own compute resources. But how can you consolidate and query all of your logs and metadata for these workloads? Enter Loki, the log aggregation system from Grafana Labs that has proven to increase performance and decrease costs.

What Do Pharmaceutical Companies Need to Prioritize for a Successful Digital Transformation?

Like many industries, the pharmaceutical industry is undergoing a rapid transformation powered by technology. These technologies allow companies to improve business operations and empower the innovation needed to be competitive in today’s market. For pharmaceutical companies, time to market a new product can be costly and time-consuming. In this complex and regulated industry, it can take over a decade to bring a new therapy to market, while costs can total over $2 billion.

How to monitor etcd

Learning how to monitor etcd is of vital importance when running Kubernetes in production. Monitoring etcd will let you validate that the service performs as expected, while detecting and troubleshooting issues that could take your entire infrastructure down. Keep reading to learn how you can collect the most important metrics from etcd and use them to monitor this service. etcd is a foundational component of the Kubernetes control plane.

SCOM Connector for ServiceNow - New Features Released

Our SCOM Connector for ServiceNow will enrich your ServiceNow deployment with direct integrations with Microsoft SCOM. Our suite of solutions are fast and easy to deploy, offer seamless integration, and can be fully customized. Streamlining your ServiceNow Incidents, CIs and mapping with SCOM has never been easier, with these new features we’ve just released.

Application Logs: 8 Goals and Best Practices to Aim For

Running a successful company relies on current and accurate information about the underlying systems. Much of this information is contained within your application logs. By investing in your log management solution, you can unlock these crucial insights and access a wealth of powerful data. This post presents a series of goals that will allow you to make the best possible use of your application logs.

The Top Elasticsearch Problems You Need to Know

The ELK stack is an industry-recognized solution for centralizing logging, analyzing logs, and monitoring your system use and output. However, the challenges of maintaining your own stack overcoming common Elasticsearch problems need to be considered. The popularity of the ELK Stack can be boiled down to two, key tenets. First, the management and analysis of logs is an incessant issue for developers, SMBs, and enterprises alike.

Enabling Microsegmentation with Calico Enterprise

Microsegmentation is a security technique that is used to isolate workloads from one another. Microsegmentation limits the blast radius of a data breach by making network security more granular. Should a breach occur, the damage is confined to the affected segment. Application workloads have evolved over time – starting from bare metal, to a mix of on-prem and cloud virtual machines and containers.

No, You Still Don't Need a Blockchain

A couple of years ago, I wrote about why you don’t need a blockchain. Blockchain is one long transaction log that always gets written to and is never backed up. It’s a ledger, more or less, with some math. And while distributed ledgers can be useful for some scenarios, I’m here today to say you still don’t need a blockchain. What turns a distributed ledger into a blockchain is cryptography for creating a digital signature to reduce the risk of data tampering.

AppOptics Product Update Roundup: Q2 2020

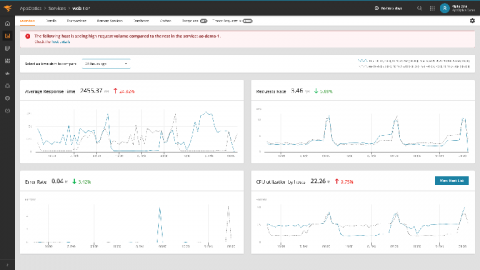
A lot happened last quarter, so you might have missed a few of the shiny new features now included with SolarWinds® AppOptics™. Don’t worry, we rounded up the recent updates here so you can get the most out of your application performance monitoring (APM) with AppOptics. Simplified Application Root Cause and Service- and Trace-Level Root Cause Summary Views The new service- and trace-level views expand the types of IT professionals who can use AppOptics.

Godoc in GoCenter Tells A Go Module's Story

Using an open-source Go module from the community of other developers can be like going on a blind date. That “getting to know you” phase that can be awkward and risky. The more you know in advance, the better off you’ll be, right? When using software, having accurate and precise documentation is one of the most important aspects. Good software documentation tells the story of what a particular piece of code does and how to use it.