Operations | Monitoring | ITSM | DevOps | Cloud

Latest Posts

Multilingual Web Design - How Not to Get Lost in Translation

Most designers have learned, often the hard way, that language differences can wreak havoc on their web designs. Leaving aside the issue of languages that go right to left instead of left to right, or down rather than across, there’s the big issue of variable word lengths. How do you accommodate this variability when designing web pages? The translation services company I founded, Tomedes, supports more than 1,000 language pairs, so we have some experience to share.

Employees are on board with on-boarding

A miserable first day on the job can often be worse for employers than it is for employees. In response to a 2018 survey from West Monroe, 45% of new hires said they rebooted their job search after their first day didn’t go as hoped.  There is an obvious—but not easy—solution to avoiding the mutual misery: a smooth onboarding process, which leaves a great impression and dispels any confusion that might tarnish it.

Building a Scalable End-to-End Host Monitoring Solution with InfluxDB Enterprise

“If you can’t measure something to get results, you can’t possibly get better at it. Worse yet, you won’t know what you should be focusing on,” says Dennis Brazil, Sr. Engineering Manager, SRE Monitoring at PayPal. Brazil and his team needed a scalable end-to-end host monitoring solution to keep pace with the company’s infrastructure modernization to a container-based architecture.

Increase Visibility with Configuration Monitoring

Network devices underpin every modern infrastructure environment with the switches and routers of your environment representing the roads information needs to travel on to reach its intended destination. And if switches and routers are the roads, picture configuration files as the traffic lights, they direct, protect and support the flow of information.

Using a Status Page in your Incident response process

A status page is a communication tool that allows you to display the current working status of your various services - whether fully functional, partially degraded, severely affected, etc. The nomenclature of the service status can be defined by you. On the status page, you can also access & update the uptime and incident history data for all your internal facing or customer impacting components.

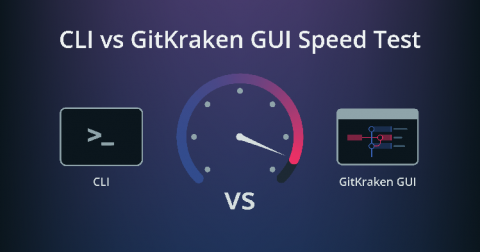
CLI vs GitKraken GUI Speed Test

The typical workday for a developer using Git involves a variety of different tasks. Between generating new SSH keys, cloning Git repositories, viewing commit diffs, creating pull requests, and on and on. But do you ever sit back and think about how much time you’re spending on each of these seemingly smaller tasks? Trust us, it adds up. The concept for the GitKraken Git GUI was born from this very frustration.

Site reliability engineering- Predictions for 2020

As we head into 2020, it's clear that DevOps has finally crossed the divide and gone mainstream. With DevOps firmly ingrained as a standard practice, we now look at how it will evolve. DevOps is driving more overall alignment between development and operations teams than has ever existed in the past. For developers, that means building and delivering impeccable apps to market quickly.

Instrumenting Lambda with Traces: A Complete Example in Python

We’re big fans of AWS Lambda at Honeycomb. As you may have read, we recently made some major improvements to our storage engine by leveraging Lambda to process more data in less time. Making a change to a complex system like our storage engine is daunting, but can be made less so with good instrumentation and tracing. For this project, that meant getting instrumentation out of Lambda and into Honeycomb.