Operations | Monitoring | ITSM | DevOps | Cloud

Latest Posts

Kubectl Logs Tail | How to Tail Kubernetes Logs

The kubectl logs tail command is a tool that allows users to stream the logs of a pod in real-time while using Kubernetes. This command is particularly useful for debugging and monitoring applications, as it enables users to view log output as it is generated and quickly identify any issues or problems with their application. In this article, we will see how to use the kubectl logs tail command to stream logs, the benefits of using the command, and an advanced tool for streaming logs.

Kubectl Top Pod/Node | How to get & read resource utilization metrics of K8s?

Kubectl Top command can be used to retrieve snapshots of resource utilization of pods or nodes in your Kubernetes cluster. Resource utilization is an important thing to monitor for Kubernetes cluster owners. In order to monitor resource utilization, you can keep track of things like CPU, memory, and storage. In this article, we will see how to use kubectl Top command to get and read metrics about pods and nodes. We will also breakdown the output to understand what it means.

What's New With Mezmo: In-stream Alerting

Here at Mezmo, we see the purpose of a telemetry pipeline is to help ingest, profile, transform, and route data to control costs and drive actionability. There are many ways to do that as we’ve previously discussed in our blogs, but today I’m going to talk about real-time alerting on data in motion, yes - on streaming data, before it reaches its destination.

Does Your Observability Practice Lack Maturity? Here's What to Do.

Observability isn’t new. But organizations are struggling to adopt mature observability practices, and the impact on business is palpable. Organizations are seeing the value of observability for their applications and infrastructure—the results of our 2024 Observability Pulse survey of 500 global IT professionals reflects that across the board.

Manage incidents seamlessly with the Datadog Slack integration

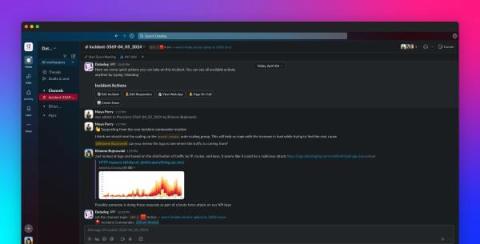
Modern, distributed application architectures pose particular challenges when it comes to coordinating incident management. DevOps, SREs, and security teams—often spread out across separate locations and time zones, and equipped with limited knowledge of each other’s services—must work quickly to collaboratively triage, troubleshoot, and mitigate customer impact.

Balancing AI Workloads and Energy Demands with DCIM Software

AI-driven processes, including machine learning models and data processing, require significant computational resources which can lead to increased energy consumption and heightened operational costs. The complexity of these workloads, which often involve real-time data analysis and continuous model training, exacerbates the need for robust data center management.

Monitoring vs Observability

Before we start, I have a confession: I absolutely love Digg (people are still Digging things, right?) errr...Reddit. It actually is my front page to the internet, where I research upgrades for my home lab/VR/other niche hobbies, watch silly videos, ingest low-effort memes, judge if people are ‘AHs’ or not on /r/amitheasshole, and occasionally talk trash to other Redditors about my Michigan-based sports teams.

How generative AI facilitates ITOps modernization

IT teams need immediate and automatic access to machine data and institutional knowledge to move faster and make the right decisions. And they need context to identify incidents and understand how to resolve them. AIOps enables this by transforming noisy and fragmented operations data into actionable insights. This is the foundation of full-context operations. Full-context operations combines observability and other machine-generated data with historical, expert, and institutional knowledge.