Operations | Monitoring | ITSM | DevOps | Cloud

Latest Posts

The Power of Synthetic Data to Drive Accurate AI and Data Models

We live in a data-rich world - every click, swipe, like, share, and purchase online generates data points companies use to optimize offerings. However, even vast real-world data has limitations in developing robust artificial intelligence (AI) and data models, particularly with regard to AIOps (Artificial Intelligence for IT Operations). Enter synthetic data.

Where to automate resilience testing in your SDLC

When organizations begin to deploy resilience testing or Chaos Engineering, there’s a natural question: can we integrate this with our CI/CD pipeline or release automation tools? After all, you’re likely running unit, performance, and integration tests already—is resiliency different? The short answer is yes—to both. Integration is possible, but resiliency is different, so automation is a nuanced conversation.

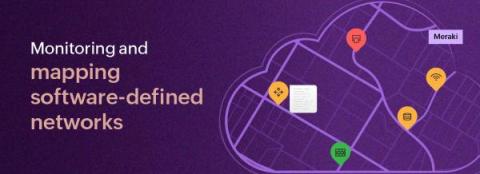
Simplified device health monitoring and mapping for software-defined networks

Are you juggling too many different types of network monitoring dashboards at once? If you're using software-defined networks (SDNs) and also managing traditional networks, it can be quite challenging to monitor them both at the same time since you need to remember which tool is responsible for monitoring which network and keep switching between them. Doing this can be a real hassle, but worry not!

Better, Faster, Stronger Network Monitoring: Cribl and Model Driven Telemetry

New in Cribl 4.5, the Model Driven Telemetry Source enables you to collect, transform, and route Model Driven Telemetry (MDT) data. In this blog, you’ll learn how to explore the YANG Suite to understand the wide variety of datasets available to transmit as well as how to configure the tools to get data flowing from Cisco IOS XE network devices to Cribl Stream.

How IT administrators can streamline operations using the LogicMonitor API

In today’s fast-paced IT ecosystem, agility and efficiency are not just goals but necessities. So why waste an hour (or more) manually onboarding individual devices when you can leverage the LogicMonitor API to automate the onboarding process for an entire site in just minutes from a simple CSV file? In this article, we’re going to review how LogicMonitor administrators can maximize efficiency and transform their IT operations using LogicMonitor’s REST API and Powershell.

Introducing an OpenTelemetry Collector distribution with built-in Prometheus pipelines: Grafana Alloy

In the opening keynote of GrafanaCON 2024, we announced our newest OSS project: Grafana Alloy, our open source distribution of the OpenTelemetry Collector. Alloy is a telemetry collector that is 100% OTLP compatible and offers native pipelines for OpenTelemetry and Prometheus telemetry formats, supporting metrics, logs, traces, and profiles. Some of you may be thinking: Wait, another collector?

Loki 3.0 release: Bloom filters, native OpenTelemetry support, and more!

Welcome to the next chapter of Grafana Loki! After five years of dedicated development, countless hours of refining, and the support of an incredible community, we are thrilled to announce that Grafana Loki 3.0 is now generally available. The journey from 2.0 to 3.0 saw a lot of impressive changes to Loki. Loki is now more performant, and it’s capable of handling larger scales — all while remaining true to its roots of efficiency and simplicity.

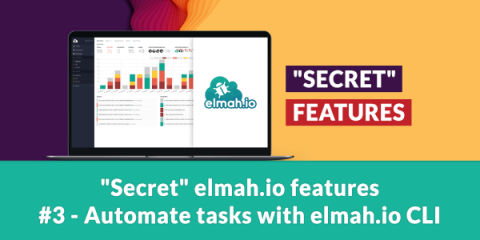
"Secret" elmah.io features #3 - Automate tasks with elmah.io CLI

In this third post in the series of "secret" elmah.io features, I want to introduce you to the elmah.io Command Line Interface (CLI). While you probably spend most of your elmah.io-related time inside the UI, the CLI offers some interesting possibilities not available through the web app. In this post, I'll show what I believe are the two most usable and helpful features of the elmah.io CLI. There are a lot of sub-commands so feel free to play around with it.