Operations | Monitoring | ITSM | DevOps | Cloud

Latest Posts

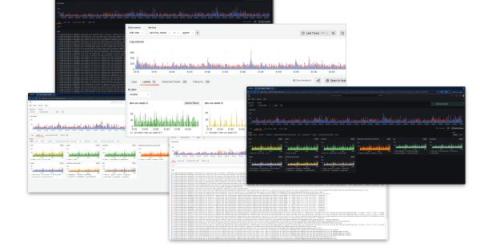
Find your logs data with Explore Logs: No LogQL required!

We are thrilled to announce the preview of Explore Logs, a new way to browse your logs without writing LogQL. In this post, we’ll cover why we built Explore Logs and we’ll dive deeper into some of its features, including at-a-glance breakdowns by label, detected fields, and our new pattern detection. At the end, we’ll tell you how you can try Explore Logs for yourself today. But let’s start from the beginning — with good old LogQL.

5 Best AI IT Support Tools in 2024

In the world of IT support, artificial intelligence (AI) has become a game-changer, revolutionizing how organizations handle tech issues. From streamlining ticketing systems to providing instant chatbot solutions, AI for IT support has proven its worth. We’ve already explored the various applications of ChatGPT for IT support, such as writing SOPs or quick email responses. Since then, AI has evolved non-stop, widely expanding its offering and capabilities for IT Service Management (ITSM).

Loki 3.0 release: Bloom filters, native OpenTelemetry support, and more!

Welcome to the next chapter of Grafana Loki! After five years of dedicated development, countless hours of refining, and the support of an incredible community, we are thrilled to announce that Grafana Loki 3.0 is now generally available. The journey from 2.0 to 3.0 saw a lot of impressive changes to Loki. Loki is now more performant, and it’s capable of handling larger scales — all while remaining true to its roots of efficiency and simplicity.

InvGate Insight, Included in Gartner's Voice of the Customer For Software Asset Management Tools

InvGate Insight was added to the latest version of Gartner’s Voice of the Customer for Software Asset Management Tools Report. The inclusion is a recognition of the tool’s usefulness for this particular practice. The Voice of the Customer is based on peer reviews and currently features eight vendors. Keep reading to learn more about this report.

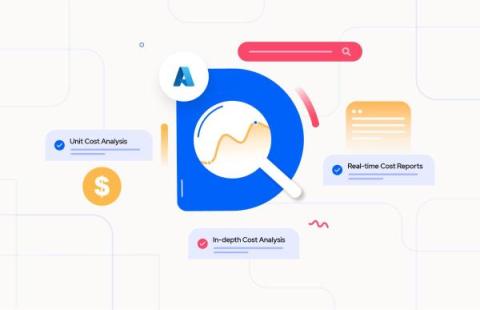
Azure Cost Analysis at the Service Name and Meter level

Azure provides a wide array of services, each with its own pricing model. Conducting detailed cost analysis helps organizations understand where their money is being spent within Azure. It allows them to identify areas of overspending or underutilization and optimize their resources accordingly. By analysing costs, organizations can identify unused or underutilized resources and either scale them down or decommission them altogether.

Where to automate resilience testing in your SDLC

When organizations begin to deploy resilience testing or Chaos Engineering, there’s a natural question: can we integrate this with our CI/CD pipeline or release automation tools? After all, you’re likely running unit, performance, and integration tests already—is resiliency different? The short answer is yes—to both. Integration is possible, but resiliency is different, so automation is a nuanced conversation.

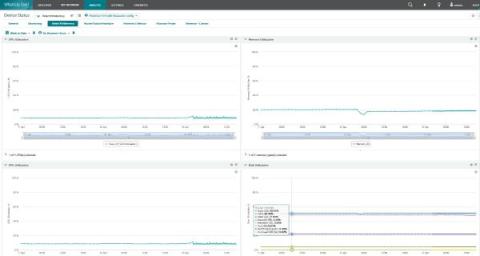
Monitoring the Health Status of Progress Flowmon Appliances with IT Infrastructure Monitoring Tools

Progress Flowmon is a core network monitoring and security tool. Confirming if it is up and running can mean the difference between responding to a data breach or overlooking such a critical event. Like any other critical system, it is a good practice to include the monitoring of Flowmon uptime, resource consumption and health in an IT infrastructure monitoring (ITIM) dashboard, such as Progress WhatsUp Gold.

"Secret" elmah.io features #3 - Automate tasks with elmah.io CLI

In this third post in the series of "secret" elmah.io features, I want to introduce you to the elmah.io Command Line Interface (CLI). While you probably spend most of your elmah.io-related time inside the UI, the CLI offers some interesting possibilities not available through the web app. In this post, I'll show what I believe are the two most usable and helpful features of the elmah.io CLI. There are a lot of sub-commands so feel free to play around with it.