Operations | Monitoring | ITSM | DevOps | Cloud

Latest Posts

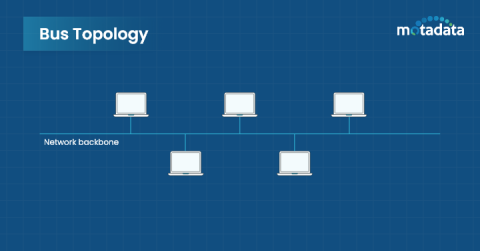
Understanding Network Topology: Types, Best Practices

When you Google ‘Topology,’ it’s defined as ‘the way something is arranged or interconnected’. A similar definition extends into the digital world, especially in a computer network. Network topology is the structure and arrangement of the network and its devices. The question is- why should you care about network topologies? The answer is that your whole work depends on the digital realm in this era, and you want everything to run smoothly.

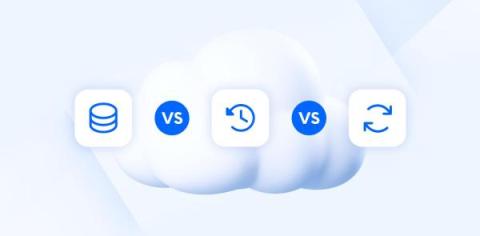
A Guide to Cloud Storage vs Cloud Backup vs Cloud Sync

Cloud-based solutions have quickly become essential to our work and personal lives. As we entrust an ever-expanding array of online data, understanding the nuances of cloud services becomes crucial to keeping data private. At the core of this digital evolution are three primary cloud services: storage, backup, and sync. While these terms may seem interchangeable, they serve distinct purposes in managing and protecting digital assets.

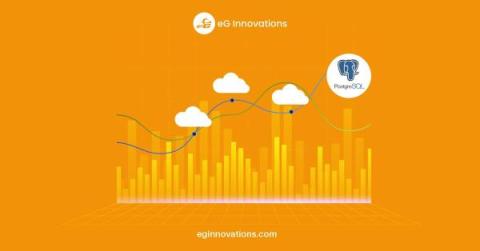
Database Trends 2024: The Power of Cloud, Consumption Models, and the Popularity of PostgreSQL

A large proportion of our customers rely on eG Enterprise to monitor and troubleshoot application and end-user experience problems caused by problems in underlying database dependencies. Our end-to-end unified monitoring and root-cause analysis platform supports all major database technologies. Over recent years, we have witnessed a significant shift from traditional on-premises databases to more dynamic, scalable solutions.

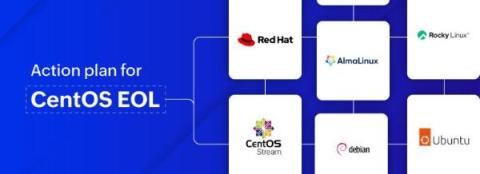
SysAdmin's guide to migrating from CentOS

CentOS EOL - Are you affected? CentOS used to be community driven. Imagine an OS being tested by a global community of volunteers against a testing team in a company—that gave CentOS unmatched stability. An OS that came with Securuty-Enhanced Linux (SELinux) by default and also included 10-year support meant it was the favorite of both individual developers and enterprises as well (even Facebook, now known as Meta, used CentOS for its data centers).

Mastering IPM: Monitor What Matters From Where It Matters

In the first installment of our IPM Best Practices Series, we explored the vast expanse of the Internet Stack and how its complex layers work in unison to keep digital services running. We laid the groundwork for understanding why Internet Performance Monitoring (IPM) is pivotal for the resilience of our interconnected world. This post zeroes in on the imperative of monitoring precisely what matters, and from the right vantage points.

Solve Teams Performance Challenges for Revenue Growth

As a business leader, you know the power of seamless digital communication. In today’s fast-paced landscape, Microsoft Teams has become the backbone of collaboration, client interaction, and overall efficiency. But when Teams falter, the consequences can be dire. It can erode your revenue streams and dull your competitive edge. That is why overcoming Teams performance challenges is essential for your organization’s success.

Getting Started with Elasticsearch and Python

In the ever-evolving landscape of data management and analytics, the integration of Python with Elasticsearch stands out as a game-changer. Elasticsearch, renowned for its robust distributed search and analytics capabilities, finds a powerful ally in Python through the Python Elasticsearch client. Elasticsearch is an open-source, distributed search and analytics engine known for its scalability and real-time capabilities.

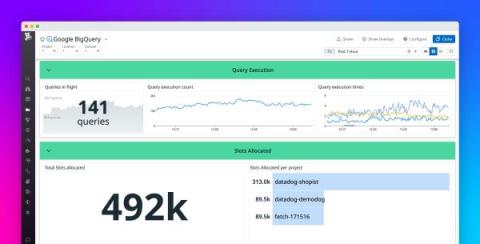
Monitor BigQuery with Datadog

BigQuery is Google Cloud Platform’s fully managed serverless data warehouse. It enables data analysis and storage at petabyte scale while eliminating the overhead of managing infrastructure. As a managed service, BigQuery autoscales and provisions compute resources and storage as needed, helping you reduce the overhead of managing infrastructure but also reducing your visibility into performance. And BigQuery users face other challenges when it comes to visibility.

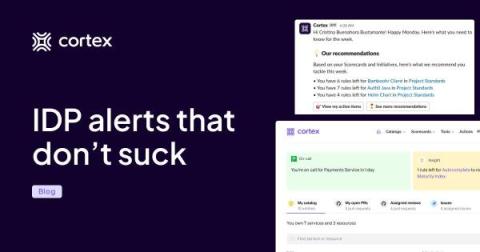
Cortex Notifications: Stay up to date while staying in flow

Notifications are designed to be annoying. Think of your phone buzzing in a quiet room: it demands your attention, lighting up your screen and making noise so you look at it. A notification is supposed to pull you away from whatever you’re working on. They can be useful, but they can also be a nuisance.

Managing Kubernetes Events with Cribl Edge

When we discuss observability for applications running in Kubernetes, most people immediately default to Metrics, Logs, and Traces – commonly referred to as the “three pillars.” These pillars are just different types of telemetry – signals that can be fed into observability platforms to help understand how an application behaves. But did you know that Kubernetes offers another valuable signal? When combined with the other signals, you get MELT.