Operations | Monitoring | ITSM | DevOps | Cloud

Latest News

The role of endpoints in the security of your network

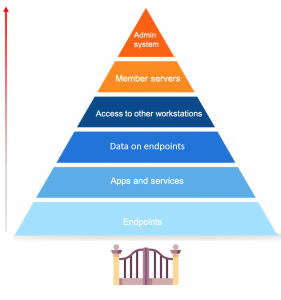
Endpoint security is a hot topic of discussion, especially now with so many businesses shifting to remote work. First, let’s define what endpoints are. Endpoints are end-user devices like desktops, laptops, and mobile devices. They serve as points of access to an enterprise network and create points of entry that function as gateways for malicious actors. Since end-user workstations make up a huge portion of endpoints, we’ll be focusing on their security.

Transforming Network Monitoring For The "Everything-As-A-Service" Era

Modern applications enable enterprises to scale faster with better efficiency and resilience. The main advantage of a multi-cloud/hybrid cloud infrastructure is in its highly distributed architecture that offers proximity – bringing end users closer to the service provider.

Basic DHCP concepts

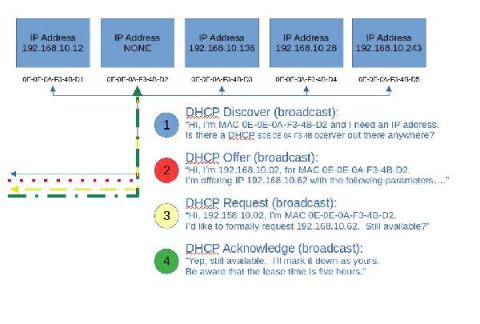
Let’s step back and take a very basic look at DHCP. In fact, let’s look at the analogy of assigning a street address to your house. Usually, this is done by the local 911 dispatch office, or some other central authority. They typically use either a survey map or a latitude, longitude pair to locate you, before they assign your house numbers from a pool of available addresses, compatible with other addresses in the area.

Using Grafana to measure the health of your NGINX instances with NGINX Instance Manager

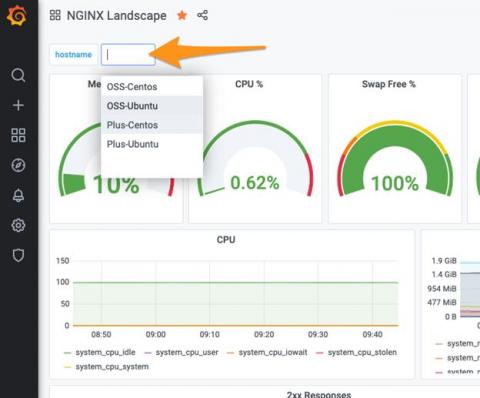
Grafana is an extremely powerful application and infrastructure observability and health platform. The ability to quickly generate operational insights from an amalgamation of sources is compelling. Grafana also benefits from the ability to natively query a Prometheus endpoint to display time-based metrics for display in a dashboard. We’ve built the NGINX Instance Manager tool to measure the health of your NGINX instances with the help of Grafana.

What is Network Visualization?

Network visualization is the practice of creating and displaying graphical representations of network devices, network metrics, and data flows. In plain speak, it’s the visual side of network monitoring and analysis. There’s a variety of different subcategories of network visualization, including network maps, graphs, charts, and matrices. In the world of IT networks, network management software will usually have some type of network visualization features built-in.

Top 5 causes of network packet loss and how to resolve them with OpManager

Network packets contain pieces of information that are sent and received enabling communication. When these network packets fail to reach their destination, it results in network packet loss. Network packet loss causes heavy latency and disruption, so, when a network suffers packet loss, it can lead to undesirable circumstances, and organizations might even end up losing business.

Run the HAProxy Kubernetes Ingress Controller Outside of Your Kubernetes Cluster

Run your HAProxy Kubernetes Ingress Controller in External mode to reduce network hops and latency. Traditionally, you would run the HAProxy Kubernetes Ingress Controller as a pod inside your Kubernetes cluster. As a pod, it has access to other pods because they share the same pod-level network. That allows it to route and load balance traffic to applications running inside pods, but the challenge is how to connect traffic from outside the cluster to the ingress controller in the first place.