Operations | Monitoring | ITSM | DevOps | Cloud

Latest News

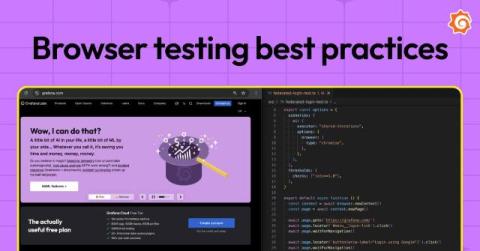
5 tips to write better browser tests for performance testing and synthetic monitoring

Given the complexity of modern websites, browser testing is essential to ensure a positive user experience. With the Grafana k6 browser module, you can interact with real web browsers and simulate user interactions — like clicking, typing, or navigating pages — to collect frontend metrics, increase site reliability, and fix performance issues before they ever impact your users.

Grafana Loki 3.3 release: faster query results via Blooms for structured metadata

The Grafana Loki 3.3 release is here, and it brings a fresh wave of enhancements aimed at making your log management experience faster, more efficient, and more scalable. While this update includes the usual round of bug fixes and operational improvements, the standout feature is a shift in how Loki leverages Bloom filters—going from free-text search to harnessing the power of structured metadata.

What is Single Pane of Glass? A Complete Guide to Unified IT Management

Ever felt overwhelmed juggling multiple monitoring tools and dashboards? You're not alone. Today's IT environments are more complex than ever, and keeping track of everything can feel like watching a dozen TV screens simultaneously. That's where Single Pane of Glass comes in – it's like having a universal remote for your entire IT infrastructure.

7 Network Visibility Best Practices for Better Performance and Data Control

We rely heavily on our networks for business continuity. As technology evolves, we can do so much more. At the same time, increased complexity makes it challenging to keep track of everything. Reaching and maintaining network visibility sometimes feels like chasing the carrot at the end of the stick.

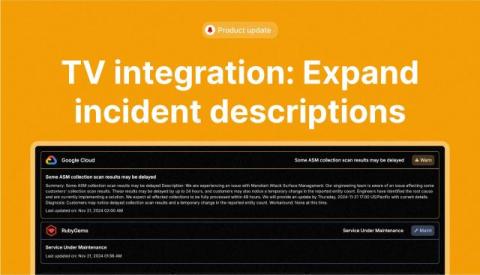
TV Integration: Expand incident descriptions

We’ve added a helpful new option to our TV Integration that lets you choose how incidents are displayed. With this update, you can enable expanded incident descriptions to show full details directly on your TV dashboard. This feature is perfect for teams that need more context at a glance, making it easier to stay informed and respond quickly without navigating elsewhere. You can find this option in the TV Integration settings – just check it for a more detailed view of incidents!

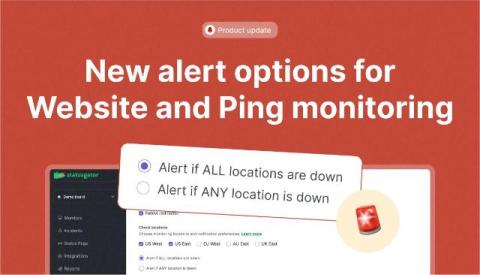
New alert options for Website and Ping monitoring

We’ve heard your feedback and added another handy improvement to Website monitoring and Ping monitoring —new alert settings to better fit your needs: These options make it easier to get the alerts that matter most to you. Check them out in the Website or Ping Monitoring configuration page and fine-tune your setup today!

Web Summit 2024: The future of AI and data governance

Last week, Lisbon was jam-packed with innovation as Web Summit 2024 saw over 70,000 attendees and 3,000 companies at one of the largest tech conferences in the world. Across the exhibition floor and track presentations, a clear theme emerged: while AI offers numerous benefits, its large-scale impact on data processing raises concerns among many parties, from consumers, legislators, and government bodies.

What is an Uptime SLA Guarantee and Should You Have One?

When someone visits your website or logs into your platform, they expect it to be available whenever needed. But downtime is inevitable, whether it’s an unexpected technical hiccup or necessary routine maintenance. Because of that certainty, tech vendors hold themselves accountable to their clients with an uptime service level agreement (SLA) guarantee. This guarantee sets clear expectations about how often your services will be available and what happens when those expectations aren’t met.