Operations | Monitoring | ITSM | DevOps | Cloud

Latest News

What a Cloud Monitoring Architecture looks like

In today’s fast-paced, digitally-driven business world, cloud computing has become the foundation of scalable and flexible IT infrastructure. As organizations transition to the cloud to gain agility, scalability, and cost savings, it becomes crucial to monitor cloud environments rigorously. This ensures performance, security, and reliability. That’s why having a good cloud monitoring system, like Icinga, is critical for cloud operations.

Beyond Backend: Honeycomb for Frontend Observability is Now GA

Real user monitoring (RUM) tools are great if you want to give your developers a very high level view of the health of your frontend. But when it comes to actually debugging issues in your web app, you’re often left piecing together outputs from browser devtools, with details (if you’re lucky) from customer support tickets to replicate issues locally in hopes of identifying the source of the issue. Debugging Core Web Vitals (CWVs) to improve your scores can be even worse.

25+ AWS Tools For DevOps And FinOps Teams To Use In 2024

Amazon Web Services (AWS) is a great platform for DevOps and FinOps teams for several reasons. It provides a wide range of services, supports extensive automation, and includes strong collaboration tools. Despite this, AWS can be a complex ecosystem that makes cloud management challenging. The good news is that AWS also offers a suite of tools to help you apply DevOps best practices and cloud cost optimization.

MSSPs and MDRs, Let's Live on the Edge!

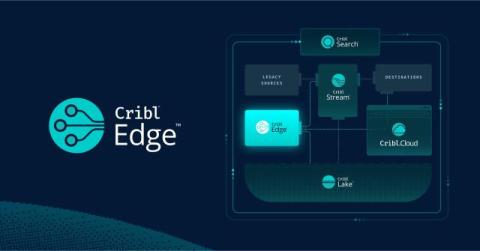
In the original post in this series, we discussed the benefits of adopting Workspaces within your Cribl Cloud organization to create isolated Cribl instances for your clients. This time around, we’re going to look at how Cribl Edge can smooth the edges of your security operations. Sorry, I had to say it. I’ll see myself out.

Real-Time Visualization for IIoT Data

With the increased adoption of the Industrial Internet of Things (IIoT), connected devices and sensors generate vast amounts of data, and you’ll need an effective way to capture, store, and visualize all of it. With effective data visualization and analysis, you can transform raw data into actionable insights and make informed decisions. This post will break down tools like Grafana, Node-RED, and time series databases, including their benefits to your IIoT workload.

Optimize Ruby garbage collection activity with Datadog's allocations profiler

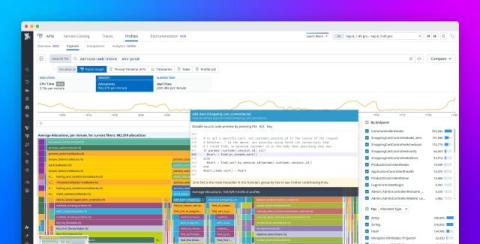
One Ruby feature that embodies the principle of “optimizing for programmer happiness” is how the language uses garbage collection (GC) to automatically manage application memory. But as Ruby apps grow, GC itself can become a big consumer of system resources, and this can lead to high CPU usage and performance issues such as increased latency or reduced throughput.

Get insights into service-level Fastly costs with Datadog Cloud Cost Management

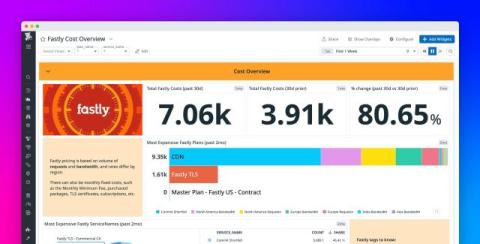
As your organization scales its applications across many different cloud and SaaS providers, it becomes more challenging to understand your costs. You likely receive your bill at the end of the month, meaning you don’t have real-time visibility into who’s spending what and which services or applications your teams are spending the most on. Changing service costs also makes it difficult to break down your costs and identify what is driving spend, leaving you unable to take action.