Operations | Monitoring | ITSM | DevOps | Cloud

Latest News

How Telemetry Data Can Improve Your Operations

Telemetry data, at its core, is all about transmitting real-time information from remote sources to centralized systems for analysis and action. This data is super important across different industries due to its ability to provide immediate, actionable insights that enhance operations and strategic decision-making.

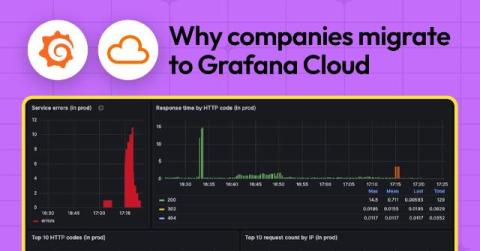
Lower observability bills, reduced MTTR, and more: why companies migrate to Grafana Cloud

There are a lot of factors that go into choosing an observability solution. And even after all that careful consideration, sometimes the platform you initially invest in doesn’t meet your needs, especially as your organization grows and evolves. For that very reason, we’ve seen users begin their observability journeys with another tool, and then decide to migrate to Grafana Cloud, our fully managed cloud-hosted observability platform.

Azure Machine Learning Pricing - 2024 Guide to ML Costs

Undoubtedly, AI is our future—which means it’s past time to integrate machine learning models into your FinOps multi-cloud tech stack. AI turns simple tasks into something that can be executed at the click of a button. With well-trained models, FinOps, MSPs, and Enterprises can automate cost detection, forecasting, and anomaly identification, streamlining complex financial operations without increasing their workforce. The good news?

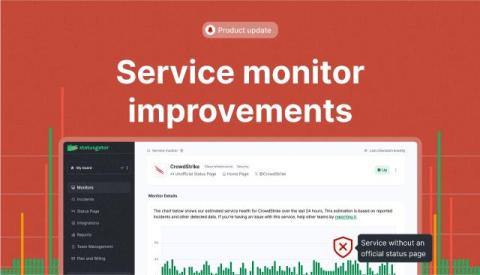
Service monitor improvements: Unofficial services, health graphs, and more

We’re excited to show you some great updates to the most-used feature of StatusGator: Third party service monitoring. This update combines several features that have been very often requested and will certainly make your StatusGator experience even better. Here’s what’s new.

A FAIR perspective on generative AI risks and frameworks

Since the release of ChatGPT in November 2022, companies have either banned or rushed to adopt generative artificial intelligence (GenAI), which is rapidly expanding in use and capabilities. Its powerful yet unpredictable nature poses significant cybersecurity risks, transforming it into a double-edged sword. However, whether generative AI poses more opportunity or risk is not necessarily the right question to ask.

Azure Data Factory Cost Optimization - Maximizing Efficiency and Minimizing Expenses

Azure Cost Optimization is one of the key factors to achieving a solid return on investment using the cloud. The more we use the resources, the more we have to pay increasing the Azure spend. But it is more important to keep an eye on the amount spent on the resources. Azure Cost Optimization is crucial for organizations leveraging Microsoft Azure to ensure they are using cloud resources efficiently, avoiding unnecessary expenses, and maximizing the value of their investment.

Apache Kafka in the Financial Services Industry

Apache Kafka plays a critical role in financial services by providing a robust, scalable, and real-time data streaming platform. The financial industry relies heavily on processing vast amounts of data quickly and reliably, and Kafka’s capabilities are well-suited for this environment. Below are some key use cases of Kafka in financial services.

Exception Monitoring in Java - A Guide to Handling Java Exceptions

Exception monitoring in Java plays a vital role in Java application performance monitoring by providing real-time insights into the health and stability of the application. Java is now the backbone of many critical and complex business applications in sectors such as banking, healthcare, finance, retail, and e-commerce. The complexity of these systems is also compounded by the fact that they involve distributed Java microservices that communicate across various layers.

Debugging INP With Honeycomb for Frontend Observability

Interaction to Next Paint is the newest of Google’s Core Web Vitals. The three metrics that make up the CWVs are Google’s attempt at defining proxy metrics for measuring things they believe are critical to a good user experience on the web. The three metrics are: Debugging and fixing these metrics can be quite complicated. In this post, I’m going to walk through how you can use Honeycomb for Frontend Observability to debug INP, which was just promoted to a stable Core Web Vital in March.