Operations | Monitoring | ITSM | DevOps | Cloud

Latest News

How Grafana Labs is reorganizing for growth

As you most likely know, Grafana Labs is growing. Growing like crazy! As Goutham Veeramachaneni noted in his blog post, “~30 people in March 2018 and now, in August 2020 we’re 180+ people. That is 6x growth in 2.5 years.” And we have no intention of slowing that growth. Matter of fact, we’re hiring as quickly as we can — and on top of that keep hiring specialists just to scale out hiring even more.

The Future of Anomaly Detection

You may be using your log data in a completely wrong way. Today, your business produces more data than ever before, and log data is at the center of all this because it contains the signals of what caused a problem. If your teams have to search for these signals in an ad-hoc manner, then they are wasting their precious time. Nearly every company in existence is dealing with this challenge because it may not have the tools to filter these signals from the noise.

Improved Pagerduty Integration with Detailed Alerts

AppSignal now supports the next API version of PagerDuty. 🎉 One of our devs was on support rotation the other day, and a customer asked whether we could add support for the next API version of PagerDuty. We won’t tell you who it was, but this developer typically answers questions by solving things as quickly as he can. So, two days later, boom! The improved integration for Pagerduty went live.

Seven Kubernetes monitoring best practices every monitoring solution should enable

Look out for these Kubernetes monitoring best practices when evaluating a Kubernetes monitoring solution. It will be easier to make sense of them if your tools are Kubernetes native. Let’s face it. Running containers in Kubernetes brings a number of advantages in terms of automation, segmentation, and efficiency. However, the ability to monitor performance and availability in an ever-changing infrastructure like Kubernetes can be a challenge.

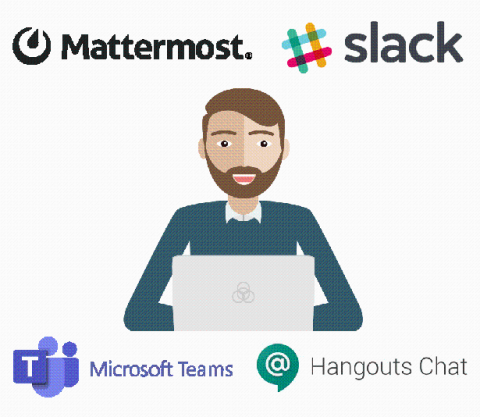
More Chatbots - Slack, Mattermost, Microsoft Teams, and Google Chat

Today, we are excited to announce PagerTree has added 3 new chatbot services including Mattermost, Microsoft Teams and Google Hangouts Chat (this is in addition to our core Slack notification channel). Chatbots are available on all pricing tiers free of charge! :) If you don’t already have an account, sign up for a free-trial now. Our chatbots are will post alert details to a “channel” of your choice.

Database Monitoring and Performance

dbaddon.mp4 - Google Drive Sign in Most modern web applications are heavily reliant on persisting data with relational databases, and so it’s no surprise that a large part of application performance monitoring relates to keeping an eye on database performance to ensure that our SQL queries are as efficient as possible. With this in mind, Scout features a Database Add-on module, and in this video, we are going to take a closer look at what it has to offer.

Achieving CI Velocity at Tigera using Semaphore

Tigera serves the networking and policy enforcement needs of more than 150,000 Kubernetes clusters across the globe and supports two product lines: open source Calico, and Calico Enterprise. Our development team is constantly running smoke, system, unit, and functional verification tests, as well as all our E2Es for these products. Our CI pipelines form an extremely important aspect of the overall IT infrastructure and enable us to test our products and catch bugs before release.

IT Pros on the Future of Automation and AI in ITSM

Think about your last online order. If you’re a frequent online shopper and have created profiles for sites you visit often (*raises hand*), then you’re probably familiar with customized recommendations. Based on your purchase history, location, and other factors, the website may suggest other items you might be interested in buying. And if you’re on the site long enough, chatbots may appear asking if you have questions or need assistance locating something.