Operations | Monitoring | ITSM | DevOps | Cloud

%term

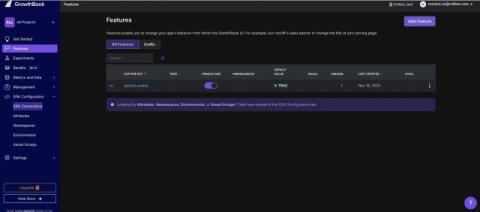
Smarter Operations: How Rollbar + GrowthBook Minimize Downtime and Boost Reliability

Software development and operations teams are the guardians of system stability, ensuring uptime, reliability, and performance across complex software ecosystems. The stakes are high—every second of downtime impacts your brand’s reputation and bottom line. That’s why integrating Rollbar’s error monitoring with GrowthBook’s feature flagging is a game-changer for ops teams.

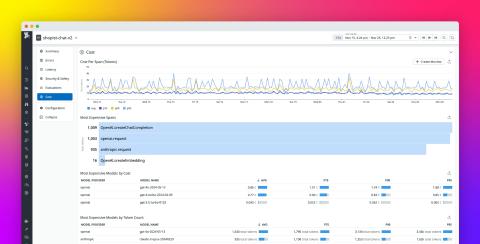
Monitor your OpenAI LLM spend with cost insights from Datadog

Managing LLM provider costs has become a chief concern for organizations building and deploying custom applications that consume services like OpenAI. These applications often rely on multiple backend LLM calls to handle a single initial prompt, leading to rapid token consumption—and consequently, rising costs. But shortening prompts or chunking documents to reduce token consumption can be difficult and introduce performance trade-offs, including an increased risk of hallucinations.

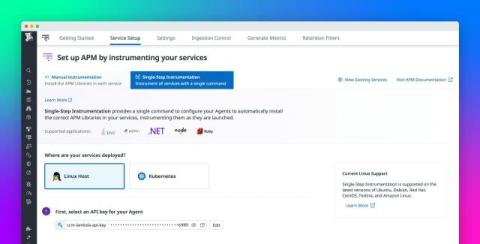
Achieve total app visibility in minutes with Single Step Instrumentation

Datadog APM and distributed tracing provide teams with an end-to-end view of requests across services, uncovering dependencies and performance bottlenecks to enable real-time troubleshooting and optimization. However, traditional manual instrumentation, while customizable, is often time consuming, error prone, and resource intensive, requiring developers to configure each service individually and closely collaborate with SRE teams.

How Datadog migrated its Kubernetes fleet on AWS to Arm at scale

Over the past few years, Arm has surged to the forefront of computing. For decades, Arm processors were mainly associated with a handful of specific use cases, such as smartphones, IoT devices, and the Raspberry Pi. But the introduction of AWS Graviton2 in 2019 and the adoption of Arm-based hardware platforms by Apple and others helped bring about a dramatic shift, and Arm is now the most widely used processor architecture in the world.

Unlocking Insights with Heroku Logs: Complete Guide

Heroku is a popular platform for deploying and scaling applications, and one of its standout features is its centralized logging system. Heroku logs give you visibility into your application’s behaviour, infrastructure events, and platform activities. When paired with a robust monitoring solution like Atatus, you can transform raw log data into actionable insights that keep your applications running smoothly.

Lightrun Unveils Game-Changing Visual Studio Extension and Dynamic Traces at AWS ReInvent 2024

As we kick off the AWS re:Invent 2024 conference, we’re thrilled to introduce two major developer observability and live debugging advancements that bring even greater power and flexibility to developers and engineering teams everywhere. These new product capabilities — the Lightrun Visual Studio Extension and Lightrun Dynamic Traces — are designed to elevate customers’ observability workflows and streamline their development processes directly within their IDE.

Duolingo: Speaking the Language of Observability with Honeycomb

In the world of digital language learning, Duolingo stands out as a beacon of innovation and user engagement. With millions of users worldwide, their platform is designed not only to teach languages, but also to create a fun and engaging learning experience. Running on the robust AWS cloud infrastructure, Duolingo manages vast amounts of data and user interactions daily. As the company experienced rapid growth, Duolingo remained steadfast in their commitment to delivering a high-quality user experience.