Operations | Monitoring | ITSM | DevOps | Cloud

%term

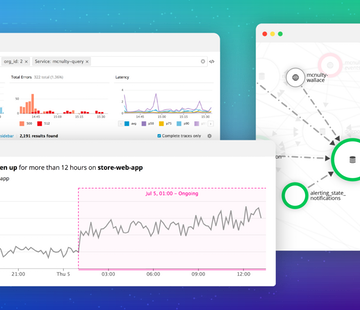
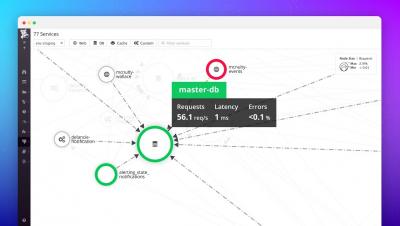
Datadog APM gains 3 superpowers: Trace Search, Service Map & Watchdog

Since we made Datadog APM generally available last year, we have continually added new features and support for new languages and frameworks to ensure that you can monitor every aspect of application performance. Datadog APM helps companies such as Airbnb, Square, and Zendesk to optimize application performance and deliver top-notch customer experiences.

CloudReady Dashboards Tips & Tricks Part #1

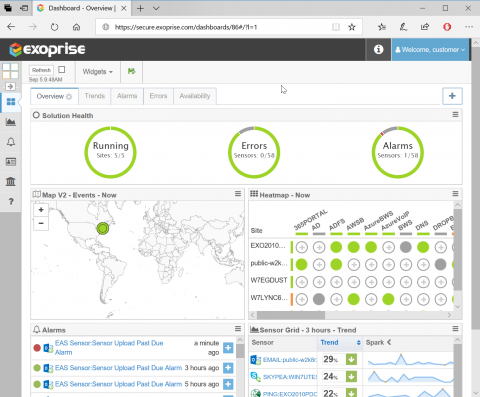
CloudReady dashboards enable a great degree of customization, a wide array of widgets, and the ability to build visualizations for monitoring the health, availability, and performance of all of your SaaS apps — especially Office 365. If you’re going to build a dashboard for all of your cloud/SaaS apps you want to be able to customize and get it just right for the different teams within your organization.

Introduction to the Integration Module for Atlassian Jira

The Kelverion Integration Module for Atlassian Jira provides a powerful integration capability for writing Azure Automation and Service Management Automation runbooks as well as being usable in PowerShell scripts. The Integration Module supports the Atlassian Jira Software and Atlassian Jira Service Desk. Using Kelverion smart discovery the Integration Module interrogates Jira and discovers how it has been configured providing a forms based view of the tables, fields, properties and allowed inputs for mandatory and optional fields. This significantly reduces the complexity of integration and level of knowledge required of APIs and Jira configuration, simplifying the process of building and supporting automation runbooks. Build runbooks with script free interaction with Jira using 21 activities. Simplify Runbook design by automatically mapping table columns to Azure Automation input properties, filters and published data items. Create, Delete, Update and Get Records in Jira.

Monitive

Monitive is an uptime monitoring service, where users sign up and input their website address, which we check every minute, from a random location around the world, and instantly notify them when their site is down.

Kamon

Kamon is a monitoring toolkit for applications running on the JVM. It gives you Metrics, Tracing and Context Propagation APIs without locking you to any specific vendor.

Ensure Seamless Upgrade to Citrix XenApp & XenDesktop 7.x. See How eG Enterprise Can Help.

Citrix XenApp 6.5 has reached EOL. As Citrix customers migrate to XenApp & XenDesktop 7.x, they need to ensure to deliver exceptional user experience during and after the migration. Watch this video and learn how eG Enterprise helps monitor the performance of your Citrix environment end to end and achieve migration success.

Docker scanning for Jenkins CI/CD security with the Sysdig Secure plugin.

In this blog post we’ll cover how to implement Docker Scanning for Jenkins with the Sysdig Secure Jenkins plugin. The plugin can be used in both freestyle and pipeline jobs to scan images and fail the build if the image fails a policy evaluation.

Announcing Incident Command Center Enhancements

The Incident Command Center (ICC) empowers your organization to command, control, and coordinate incident response without having to leave the OpsGenie app. With the ever-expanding demand for always-on services, increasing uptime is just as critical. Streamlining incident response leads to faster resolution of issues and less headaches for your customer.

Key metrics for AWS monitoring

Since 2006, Amazon Web Services (AWS) has spurred organizations to embrace Infrastructure-as-a-Service (IaaS) to build, automate, and scale their systems. Over the years, AWS has expanded beyond basic compute resources (such as EC2 and S3), to include tools like CloudWatch for AWS monitoring, and managed infrastructure services like Amazon RDS for database management.