Operations | Monitoring | ITSM | DevOps | Cloud

%term

Kubernetes Monitoring with Prometheus -The ultimate guide (part 1).

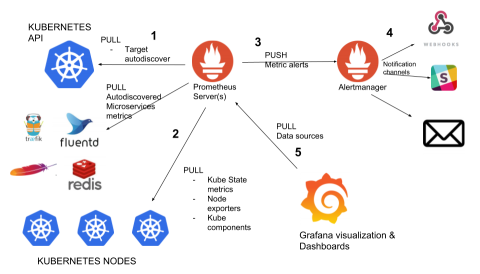
Prometheus monitoring is fast becoming one of the Docker and Kubernetes monitoring tool to use. This guide explains how to implement Kubernetes monitoring with Prometheus. You will learn how to deploy Prometheus server, metrics exporters, setup kube-state-metrics, pull, scrape and collect metrics, configure alerts with Alertmanager and dashboards with Grafana.

Introducing the Service Map in Datadog

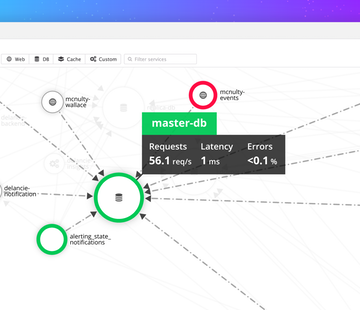
When your pager goes off at 3:00 a.m. and you need to begin your investigation, where do you start? Before you can attack the problem, you need to know the lay of the land: What else is potentially affected by this failing service? What are its dependencies? Where are the probable root causes? With the new Datadog Service Map, you can visualize the topology of your application to answer these questions and more.

Feature Spotlight: Email Server Checks

Because email is communication is prevalent in today’s business landscape, use Uptime.com’s email server checks to continually monitor email server status. Let’s get familiar with the three different types of email checks you can implement. Simple Mail Transfer Protocol (SMTP) checks monitor the flow of email across the Internet.

The New VirtualMetric Infrastructure Monitoring Suite - Evolved Dashboard and Exceptional UX-

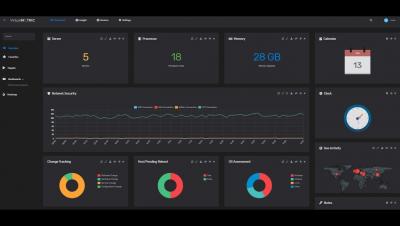
VirtualMetric's team is presenting an Exclusive Closed Webinar - The New VirtualMetric - Evolved Dashboard and Exceptional UX. During the past months, we have put in all efforts to improve our infrastructure, server and virtualization monitoring and tracking solution and create outstanding experience and functionalities for our customers. Now, we want to share all the changes and improvements with you!

Is Citrix Director Sufficient for End-to-End Monitoring of Citrix Workspace Environments?

In a previous post, we discussed the capabilities and functionalities of Citrix Director, a built-in monitoring tool that is available as a part of Citrix XenApp and XenDesktop deployments. While Citrix Director provides high-level analytics about user sessions, user logon information and logon time breakdowns, connection failures, etc., is it designed to be the end-to-end, single-pane-of-glass performance management solution for Citrix Workspace environments?

A Year of Donuts: A Retrospective

A year ago, I introduced a new Slackbot, fondly known as Donut, to PagerDuty. When I interned in San Francisco last summer, I was looking for ways to meet people who weren’t on my team, in my department, or even in the same office as I was. Randomly messaging employees in the Toronto office or on the Sales team seemed like a little much, even for someone like me, who enjoys taking occasional strides outside of her comfort zone.

Creating a Chrome extension in 2018: The good, the bad and the meh

Last week, we shipped an initial version of Puppeteer Recorder, a Google Chrome extension that records your browser interactions and generates a Puppeteer script. It turns out Chrome extension development is almost like real web development, but with a weird dash of quasi embedded development mixed in. This post talks you through the development lifecycle when creating an extension and lists some of the architectural gotcha’s. Source code for the extension in question is on github.

New Integration: Mattermost

We’ve just added an integration with Mattermost which means you can now get all of your StatusCake alerts through to this application. Mattermost is a deployable, cloud based, open source alternative to services like Slack, HipChat, and Pushover. The focus is on security and collaboration, with all of the usual essential team functionalities such as File Sharing, Custom integrations, threaded conversations and group messaging.