Operations | Monitoring | ITSM | DevOps | Cloud

%term

Monitoring Django apps on Heroku

I don't know of an easier way to deploy a Django app than letting Heroku do the work. That said, how do you stay on top of your app's performance, errors, and stability post-launch? Running an app on Heroku is a blissful experience, but it presents some monitoring challenges that aren't present when you control the hardware. In this post, I'll walk through a free-to-start, low-effort approach that gives you great visibility of the health of your Django app on Heroku.

Accelerating Incident Response With Real-Time Business Data at Wayfair

Like any good e-commerce company, Wayfair collects a significant amount of data to use for business intelligence. Until recently, the majority of this data was crunched off-hours in preparation for business use the next day. We also create a great deal of data about our applications and infrastructure in real time.

Volunteers, Not Conscripts: Fixing Out-Of-Hours On-Call at Intercom

Uptime matters. At Intercom, we believe that keeping our product online and working well at all times is critical to the success of our business. Out-of-hours on-call is inherently disruptive to your life as an engineer. You need to be ready to respond quickly and competently to an alert about something being broken.

The top 5 VM metrics that every Azure admin should monitor

The age-old approach of storing data on self-hosted data centers is rapidly becoming obsolete, with most organizations shifting towards cloud solutions like Microsoft Azure. Azure delivers more than 600 services like on-demand computing, storage, data management, and networking, and virtual machines (VMs) are an important component of the Azure cloud platform.

Network Ops: Bigger and Badder Than Ever

Remember when automation, cloud, containers, hyperconvergence, and microservices were going to radically simplify networking and IT? After a brief, semi-uncomfortable transition, we’d all enjoy someone else worrying about platform details, and focus on moving our businesses forward. But after a decade of hype, networks are larger, more complex, and under higher-than-ever demand. This is not what was advertised.

Logtrail + Kibana = Retro Terminal Experience

Logtrail is a popular Kibana plugin that makes Kibana look like Papertrail. Sematext’s Logtrail view in Kibana gives you the terminal-like experience of exploring logs without the pain of needing to ssh into machines. With Logtrail you can see new logs appearing at the bottom of the screen instead of the top screen, you can filter logs like with grep, and “jump” to different parts of the log stream like when using less.

Feature Spotlight: TCP/UDP Checks

We live in an incredible global economy where workers from all over the world pitch in to complete major products, develop new technology, and change the world. Here at Uptime.com, our workforce is spread across the globe, and we know many of you reading probably have a similar setup. The benefits of hands on a website at all hours of the day are numerous, so long as connectivity remains alive and well. That’s where a TCP/UDP Check provides immeasurable value.

On-premises HipChat and Slack alternative (with migration services)

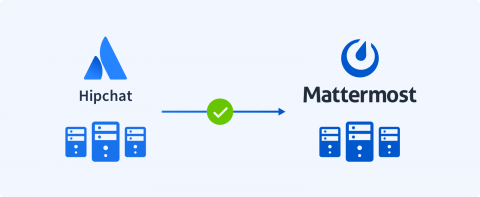
After HipChat’s end-of-life announcement, Mattermost began working with the Atlassian community to develop a migration path to Mattermost as a private cloud alternative to HipChat and Slack. We’re excited to announce a new community of Atlassian partners that can help HipChat customers maintain and expand their productivity by moving to a self-hosted Mattermost solution.