Operations | Monitoring | ITSM | DevOps | Cloud

How to

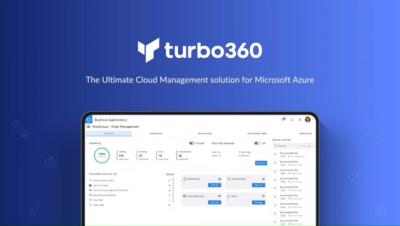
What's new in Turbo360 - Reservation recommendations report, Automatic cost anomaly detection....

Turbo360 brings a suite of enhancements this month, which includes automatic cost anomaly detection, group budget monitoring, and savings alerts based on rightsizing and reservations. Plus, generate reservation recommendation reports for Azure subscriptions with the Azure Documenter. Experience a smoother workflow with improved service principal access policies and much more!

Set up a maintenance window on ilert mobile app

ilert's maintenance windows feature allows users to schedule downtime for alert sources and services. This ensures that on-call responders won't receive alerts from alert sources during maintenance and service, and status page subscribers will be informed about planned and ongoing service maintenance. In this video, you will learn how to use this feature on ilert mobile app.

5 Ways in Which ITAM Software Can Help Your IT Budget Planning

An IT budget is a defined plan for a period related to hardware, software, and other IT service costs. It is a financial plan or allocation of funds that an organization sets aside to cover IT expenses, planning, and investments. This document is vital to the overall organizational budget, reflecting the resources committed to IT service delivery. Having a well-planned IT budget plan will help you.

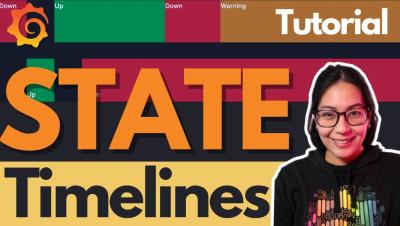
How to Configure a State Timeline Panel | Grafana

💡 Do you want to know how and when to use state timeline visualizations? Join Senior Developer Advocate Marie Cruz in this beginner-friendly tutorial to learn how to configure a state timeline panel in Grafana. ☁️ Grafana Cloud is the easiest way to get started with Grafana dashboards, metrics, logs, and traces. Our forever-free tier includes access to 10k metrics, 50GB logs, 50GB traces and more. We also have plans for every use case.

Annotating Events with Grafana | Grafana for Beginners Ep. 10

As we observe our system, we are bound to come across some interesting events or failures. By flagging these events and adding context, we can communicate whether further investigation is needed or if action should be taken to address these events. This is known as annotating events. Join Senior Developer Advocate, Lisa Jung to learn how to annotate events with Grafana. ☁️ Grafana Cloud is the easiest way to get started with Grafana dashboards, metrics, logs, and traces. Our forever-free tier includes access to 10k metrics, 50GB logs, 50GB traces and more. We also have plans for every use case.
Ribbon Analytics - Discover What You've Been Missing

Would you operate a network with zero visibility? Don’t risk it, visualize your network and get ahead of the storm with Ribbon Analytics. It ingests your data. Regardless of the source. And the out-of-the-box applications will guide you through your network. Letting you see what you’ve been missing. Don’t worry, we’ve done this before… in some of the largest networks in the world. Here’s how you can get started with Ribbon Analytics: Visualize your network’s capacity -- no more guessing when you need to expand.

Configuring Alert Notifications and Policies in WhatsUp Gold

WhatsUp Gold Alert Center detects and notifies you of critical messages, failures, and other key events happening within your environment. Watch this video to learn how to set up alert notifications, so you can generate an email message when a problem occurs, or escalate an ongoing issue via a series of emails.