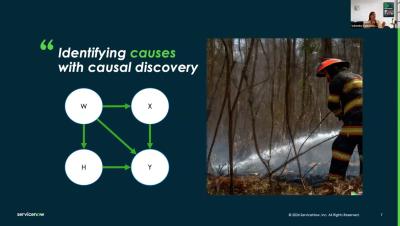
Operations | Monitoring | ITSM | DevOps | Cloud

How to

How to detect new errors in production

How to improve your release quality by using Rollbar to detect new and reactivated errors from production, staging or qa environments. Go beyond crash reporting, error tracking, logging and error monitoring. Get instant and accurate alerts — plus a real-time feed — of all errors, including unhandled exceptions. Our automation-grade grouping uses machine learning to reduce noise and gives you error signals you can trust.

How to set up Azure budget alerts - A Step-by-Step Guide

Azure cost monitoring - Create and manage budgets When it comes to managing costs in the Azure cloud, it is essential to have a reliable system that can help you keep track of your spending and alert you when you are getting close to exceeding your budget. This is where Turbo360's Budgets monitoring feature comes in. The Azure Budgets monitoring feature in Turbo360 is designed specifically for Azure cost monitoring. It allows you to create budgets for your Azure resources, monitor your spending, and receive alerts when you are approaching or exceeding your budgeted amount.

Datadog on Site Reliability Engineering #shorts #datadog #observability

There are many different ways to implement Site Reliability Engineering (SRE). From team structures to roles and responsibilities to planning and prioritization flows, there’s no golden path for how to organize things. As Datadog has shifted from a startup to a quickly-growing public company, we’ve seen our own SRE practice evolve. With over 22,000 customers sending trillions of data points each day, keeping Datadog reliable is critical to our business.

Creating alerts with Grafana | Grafana for Beginners Ep 11

When observing your data with Grafana, you don't need to be glued to your dashboard 24/7. Join Senior Developer Advocate, Lisa Jung to learn how to set up Grafana to keep an eye on your data and alert you if something needs your attention! The following are covered in this episode: ☁️ Grafana Cloud is the easiest way to get started with Grafana dashboards, metrics, logs, and traces. Our forever-free tier includes access to 10k metrics, 50GB logs, 50GB traces and more. We also have plans for every use case.

Using Telegraf to Feed API JSON Data into Kentik NMS

Discover how to harness API JSON data for Kentik NMS using Telegraf in this insightful video by Justin Ryburn. Learn to containerize with Docker Compose, configure Telegraf to collect and transform metrics, and seamlessly integrate them into Kentik's network monitoring system. A step-by-step guide for enhancing your NMS capabilities with API data.

Optimizing Kubernetes Infrastructure: Minimizing Idle Resources | DevOps Tutorial

Welcome to our comprehensive DevOps tutorial on optimizing Kubernetes infrastructure! In this video, we will delve into the challenges faced by DevOps professionals when managing complex and dynamic Kubernetes environments. Specifically, we'll focus on the issue of idle resources and provide you with four effective techniques to minimize them with Spot Ocean.

How to combine POMs (Page Object Models) with Playwright Fixtures for better developer experience

Page object models (POM) are common to encapsulate test automation logic and improve code readability. Learn in this video how to combine POMs and Playwright fixtures for effective end-to-end testing and synthetic monitoring with an excellent developer experience. Got questions? Join the Checkly community Slack. And tune in next week for more on Playwright, Synthetic Monitoring, and API Monitoring. Happy testing!