Operations | Monitoring | ITSM | DevOps | Cloud

%term

CVE-2024-21410: Ensuring Secure Firmware Updates in Industrial Devices

Security vulnerabilities are a serious issue for any organization. Even a single unpatched flaw can lead to disastrous consequences, including data breaches and loss of system integrity. CVE-2024-21410 is one such vulnerability that presents a significant risk. Found in a popular application used by many organizations, this flaw can leave systems exposed to attacks if not addressed promptly.

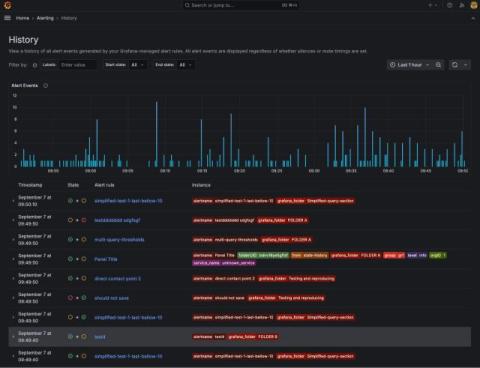
Better root cause analysis: Mastering alert insights with the new central history timeline

A year ago we rebuilt our alert rule state history, using Grafana Loki for storage and updating the UI to display a timeline of all state changes of an alert rule. As a result, users can now conduct better root cause analysis by going down to the level of an alert rule and seeing when certain alert instances started or stopped firing. But we aren’t stopping there. To ensure system stability and avert outages, you also need one place to see the state history for all the alerts in your system.

New Relic vs Grafana - 2024 Comparison

New Relic and Grafana are leading tools in monitoring and observability, each with distinct use cases. New Relic excels in Application Performance Monitoring (APM), providing detailed insights for application performance. In contrast, Grafana is designed for data visualization and monitoring, allowing users to create customizable dashboards for metrics and logs. This article provides a clear comparison of their features, including application performance monitoring, log management, and dashboards.

5 Automated GCP Optimizations That Make Cloud Cost Savings Simple

As both the State Of FinOps 2024 and the State Of Cloud Costs In 2024 indicate, reducing cloud waste remains a top priority for cloud-driven organizations. Cloud spenders care more than ever about cost efficiency — and CloudZero is working tirelessly to make cloud savings simpler. To this end, we’re proud to announce that we’ve added a suite of automated GCP optimizations to our Insights feature.

15 Application Monitoring Tools To Consider In 2024

Also known as application performance monitoring (APM), application monitoring tools track and analyze application performance. They monitor application metrics such as CPU usage, response times, error rates, and uptime. The tools also offer real-time insights to identify issues, improve user experiences, and optimize resources. But are APM tools really necessary?

Nexthink the Clear #1 Vendor in DEX. Whichever Way You Look at It.

This headline is maybe a little surprising, even for Nexthinkers. We’re known for being conservative and letting our work do the talking. Nexthink first created the DEX category, then rolled out the world’s most capable and holistic DEX platform, and then delivered year on year as the most successful DEX vendor in the market. Something to do with our Swiss heritage perhaps – an emphasis on diligence and execution, rather than on singing our own praises.

Turbo360 FinOps and Cost Management Is Now Available in the Microsoft Azure Marketplace

Microsoft Azure customers worldwide now gain access to Turbo360 to take advantage of the scalability, reliability, and agility of Azure to drive application development and shape business strategies. Turbo360, an advanced cloud Management platform, today announced the availability of its flagship module, FinOps and Cost Management for Azure, in the Microsoft Azure Marketplace.

AlertOps Announces Integration with ServiceNow to Enhance Incident Management and Response

AlertOps announced its new integration with ServiceNow to enhance incident management and response capabilities for ServiceNow customers. This joint effort enables AlertOps to create better experiences and drive value for customers by providing real-time notifications, bi-directional data synchronization, and seamless integrations. ServiceNow’s expansive partner ecosystem and partner program is critical in supporting the Now Platform’s $275 billion forecasted market opportunity through 2026.

Essential Linux Logs To Monitor for System Health

Linux is an open-source operating system kernel originally created in 1991. It has a reputation for being versatile, stable, and secure, hence its wide use on computing devices, beginning from servers and mainframes down to desktop computers, smartphones, and embedded devices. The broad uses for Linux and its popularity have led to the demand for effective monitoring.