Operations | Monitoring | ITSM | DevOps | Cloud

Alerting

New Features: Next-Generation Notifications UI, Take-On Call Widget, Alert Templates, Dynamic Policy Routing, Service Groups

This post highlights some of the features and improvements that we have released in the last two months. If you want to submit your own ideas or vote on existing feature requests, you can now use our public roadmap at roadmap.ilert.com.

SIGNL4 Onboarding: Scheduling - Creation & Options

The SIGNL4 Onboarding series walks users through the process's of SIGNL4 from Signup to Alerts to Settings. Todays video focuses on Scheduling users for duty shifts. Learn how to schedule users for SIGNL4 shifts and about the scheduling options and how they affect your team and schedule. Learn how to create a schedule and then copy this schedule so you only have to create it once. This video is packed with helpful tips to help you get the most out of your account.

The Dangers of Alert Fatigue: Strategies for Effective Alert Management

Alert fatigue is a serious issue that affects numerous professions, especially in the IT industry. It can lead to neglecting critical events and delaying response times. IT teams need to continuously monitor their systems and applications to avert possible downtime and keep operations running smoothly. However a high number of incoming alerts inundating these teams can make them less responsive. The ramifications of such disregard can severely affect the efficiency and dependability of IT teams.

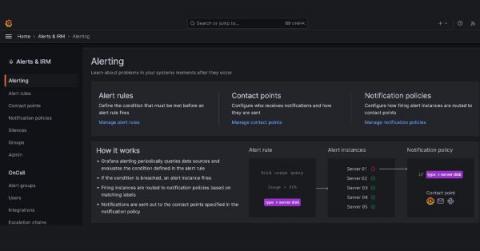
Grafana 9.5 release: Grafana Alerting updates, stronger security with service accounts, upgraded dashboards, and more

Grafana 9.5 has arrived! 🔥🎉 Get Grafana 9.5 The latest Grafana release introduces new features and improvements, such as major Grafana Alerting improvements, dashboard and visualization enhancements, a redesigned navigation experience, support bundles for faster issue resolution, and much more to provide you with better insights into your data.

Velocity vs. Cycle Time: Which Metric is Right for Your Team?

In the world of agile development, tracking the progress of work is a critical aspect of the development process. Velocity is a metric that is often used to measure how much work a team can complete in a given period. Velocity is a measurement of the average number of story points (or another unit of work) completed by the team in a sprint. The idea is to track the velocity over time to help the team plan how much work they can realistically complete in a sprint.

Alerting on the User Experience

When your alerts cover systems owned by different teams, who should be on call? We get this question a lot when talking about SLOs. We believe that great SLOs measure things that are close to the user experience. However, it becomes difficult to set up alerting on that SLO, because in any sufficiently complex system, the SLO is going to measure the interaction between multiple services owned by different teams.

8 Best IT Monitoring Tools and Software of 2023 (Updated)

Monitoring tools, also known as observability solutions, are designed to track the status of critical IT applications, networks, infrastructures, websites and more. The best IT monitoring tools quickly detect problems in resources and alert the right respondents to resolve critical issues. Response teams use observability solutions to gain real-time insights into resource availability, stability and performance.