Operations | Monitoring | ITSM | DevOps | Cloud
The latest News and Information on Application Performance Monitoring and related technologies.
Launch Notes: Native Core Web Vitals, versionised deployment tracking, updated APM
A guide to single-page application performance
Single-page applications (SPAs) present a unique approach to building web applications. They help to increase development velocity and can present big performance wins when it comes to delivering a fast and seamless user experience. Monitoring SPAs for performance still comes with a unique set of challenges, like choosing the most impactful metrics, gaining visibility into app performance over time, and knowing what metrics you can get from the browser. The main benefit of using SPAs is that a page does not need to reload when the content on the page changes. However, this feature, and the fact the page does not reload, is what makes it hard to monitor SPA performance.
From Distributed Tracing to APM: Taking OpenTelemetry & Jaeger Up a Level
It’s no secret that Jaeger and OpenTelemetry are known and loved by the open source community — and for good reason. As part of the Cloud Native Computing Foundation (CNCF), they offer one the most popular open source distributed tracing solutions out there as well as standardization for all telemetry data types.
Rappi Relies on Splunk Observability Cloud to Meet its 30-Minute Guarantee
Adding free and open Elastic APM as part of your Elastic Observability deployment
In a recent post we showed you how to get started with the free and open tier of Elastic Observability. Today we'll walk through what you need to do to expand your deployment so you can start gathering metrics from application performance monitoring (APM), or "tracing" data in your observability cluster, for free.
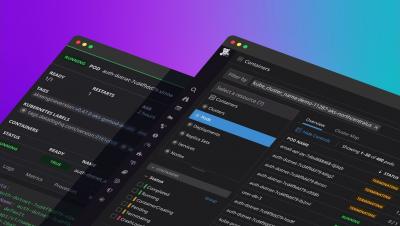
Datadog Live Containers - Kubernetes Resources
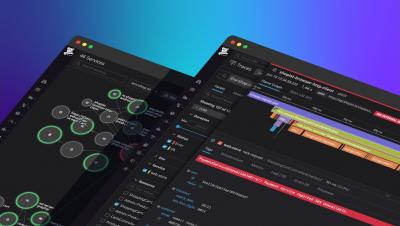
Splunk APM maximizes performance by seeing everything in your application.
10 Tools and Techniques to Test Your IT Infrastructure Resilience
Many of our customers are large enterprises with critical highly-available and secure infrastructures. This means that they spend (as do we) a lot of time proactively investigating and stress-testing systems, indeed we and many other vendors also provide tools within our products to assist in “kicking the tyres”. However small or large your enterprise is though, it’s a methodology and mindset that you can embrace with plenty of free and open-source tools out there to assist you.


