Operations | Monitoring | ITSM | DevOps | Cloud
The latest News and Information on Application Performance Monitoring and related technologies.
Launch Notes: Announcing Node.js for APM, all-new Customers, provider updates, and more
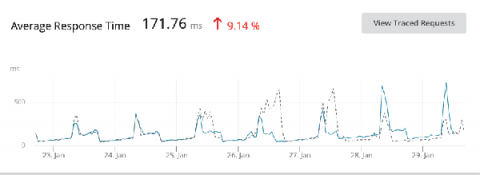
Gain more visibility into code performance with Raygun APM for Node.js
Raygun has been busy building our best-in-class APM so you can provide flawless digital customer experiences. By adding Raygun Application Performance Monitoring to your monitoring suite, your team will gain more visibility on code and server performance, achieve a faster time to resolution with finer granularity, and reduce infrastructure costs by optimizing existing services. Raygun is a developer-friendly product that surfaces more diagnostic details than other APM solutions. Combined with our usage-based pricing, we have the ability to provide companies like Olo with millions of customers with cost-efficient and powerful APM.
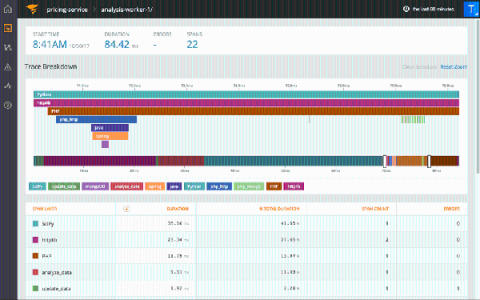
Monitoring PHP Application Performance: A Step-by-Step Guide
Mapping Built-in AWS Compliance Rules Provided by the Well-Architected Tool | Datadog Tips & Tricks
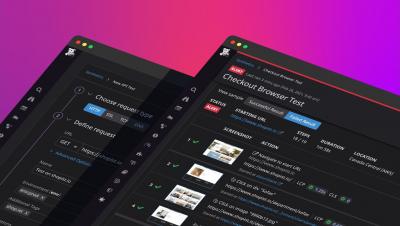
Datadog Synthetic Monitoring
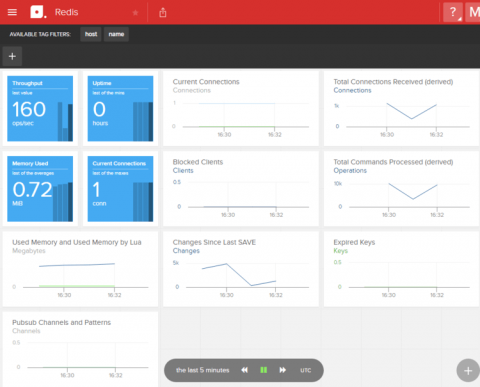
Expert Guide to Redis Monitoring
Monitoring Node.js Application With AppOptics on DigitalOcean - Better Together
VDI Monitoring
The use of virtualization for hosting server VMs is well understood. Today, most virtualization platforms provide administration and monitoring software that admins can use to track the health of their hypervisors and virtual machines (VMs). The use of virtualization for desktops is more recent.


