Operations | Monitoring | ITSM | DevOps | Cloud
The latest News and Information on Application Performance Monitoring and related technologies.
Free Java Performance Monitoring and Troubleshooting Tools - Pros and Cons
Software developers are often only concerned about the functionality of their applications. When these applications are deployed in production, scalability and performance issues surface and application developers then have to worry about performance. Many a times, such situations warrant a complete restructuring of the application code, causing significant impact to new rollouts and current users.
How tech leaders are prioritizing customer experience
The Tech Leaders' Tour is a series of events bringing tech leaders together to learn from each other about improving software quality and customer experience. This one was special because we are able to hold it in-person, in one of our favorite cities - Auckland, NZ, where there are no social distancing rules at the time of writing. In today's climate, technology companies are faced with many challenges. But one thing should remain the same - the focus on delivering value to the customer.
Improve Processes and User Experience of SalesForce.com, 24x7, in real-time
Things You Should Know Before Choosing Application Performance Monitoring Tools
Application Performance Monitoring tool has become the most emerging business to organizations to deal with complex applications. It helps in optimizing and monitoring the performance of your application. To ensure your app's performance, since it is of utmost importance for the better user-experience, the recommended approach would be to use APM tools. There are wide spectrum of application monitoring tools available in the market place.
The Symbiosis Between the OSI Model and Application Performance Monitoring (APM)
It’s no secret that Application Performance Monitoring (APM) is becoming a critical competency in today’s enterprise networks. After all, so many enterprises are moving to a cloud-based model that leverages tiers of service, which brings unforeseen complexity into the task of keeping things running smoothly.
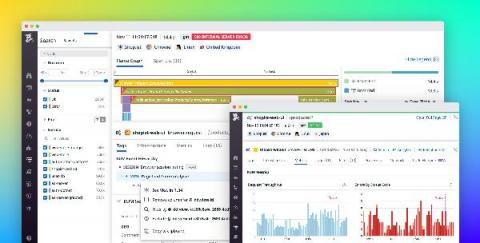
Unify APM and RUM data for full-stack visibility
Without unified visibility across your entire stack, it can be difficult to investigate backend dependencies when troubleshooting frontend issues, or to track the source of database failures that originate from bad browser requests. Full-stack visibility gives you the insight you need to pinpoint and resolve incidents quickly.


