Operations | Monitoring | ITSM | DevOps | Cloud
The latest News and Information on Application Performance Monitoring and related technologies.
AIOps 101
In all internal and external conversations that I’ve had in the recent weeks, almost always the discussion veers towards AIOps. This blog summarizes research that I’ve done into understanding AIOps – what it is, why analysts and customers are so interested in this technology and what are some of the benefits that it offers.
Datadog on Chaos Engineering
Azure Monitor for Windows Virtual Desktop (WVD)
At the end of March 2021, Microsoft released Azure Monitor for Windows Virtual Desktop (WVD) for General Availability. Built upon Azure Monitor Workbooks to give insights into the Windows Virtual Desktop environment, including: Connection Diagnostics, Connection Performance, Host Diagnostics, Host Performance, Utilizations, Users, Clients and Alerts.
Top 7 AppDynamics Competitors and Alternatives to Try in 2021
AppDynamics was founded by Jyoti Bansal in 2008. It is an application performance management (APM) and IT operations analytics (ITOA) company that focuses on managing application performance and availability in a cloud computing environment and inside the data centre.
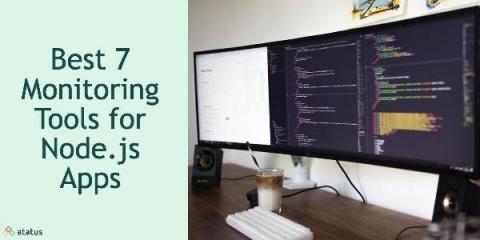
Best 7 Monitoring Tools for Node.js Application
Sometimes, applications do not perform as well as they should. Application developers are responsible for performing preventive and curative maintenance. Customers that use your application as a developer may waste a lot of money attempting to restore the applications without your help. To maintain track of your application's activities, it's best to use an effective monitoring system. Monitoring a Node.js application entails keeping a careful eye on its performance and availability.
New Relic vs Atatus
Application Performance Monitoring (APM) is used to ensure consistent availability, performance, and response times of an application. Websites, mobile applications, and business applications have use cases for monitoring purposes. Although, in the digital world, monitoring use cases expand to the processes, hosts, logs, networks, and end-users including your customers and employees.
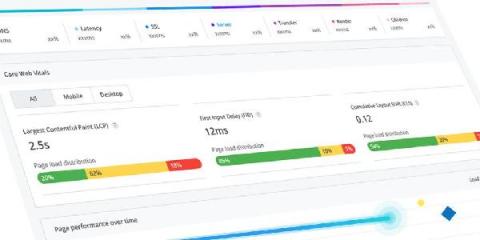
Introducing native support for Core Web Vitals
In December last year, we released tracking for Core Web Vitals using custom tagging so that you can have consolidated performance metrics that accurately reflect your customer's digital experience. Today, we are excited to continue this journey and announce our native first-class support for Core Web Vitals (CWV) tracking within Real User Monitoring. Now, you can see a detailed overview of how your website performs against Google's modern user-centric metrics, alongside all the diagnostics you need to take action.
Our first community update - Signal #01
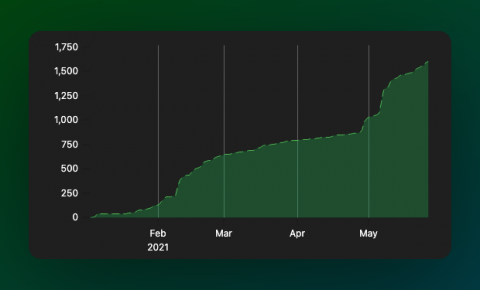
Excited to launch our first newsletter. We are delighted to have crossed 1.6k stars on GitHub, growing more than 30% last month. Catch up on what we're upto at SigNoz!


