Operations | Monitoring | ITSM | DevOps | Cloud

The latest News and Information on Containers, Kubernetes, Docker and related technologies.

Key metrics for monitoring AWS Fargate

AWS Fargate provides a way to use AWS container orchestration services—Amazon Elastic Container Service (ECS) and Amazon Elastic Kubernetes Service (EKS)—without needing to provision and maintain the infrastructure that runs your containers. Fargate is similar to serverless container platforms from Google (Cloud Run) and Microsoft (AKS virtual nodes).
How to collect metrics and logs from AWS Fargate workloads

In Part 1 of this series, we showed you the key metrics you can monitor to understand the health of your Amazon ECS and Amazon EKS clusters running on AWS Fargate. In this post, we’ll show you how you can: You can use Amazon CloudWatch and related AWS services to gain visibility into your ECS clusters and the Fargate infrastructure that runs them.

AWS Fargate monitoring with Datadog

In Part 1 of this series, we looked at the important metrics to monitor when you’re running ECS or EKS on AWS Fargate. In Part 2 we showed you how to use Amazon CloudWatch and other tools to collect those metrics plus logs from your application containers. Fargate’s serverless container platform helps users deploy and manage ECS and EKS applications, but the dynamic nature of containers makes them challenging to monitor.

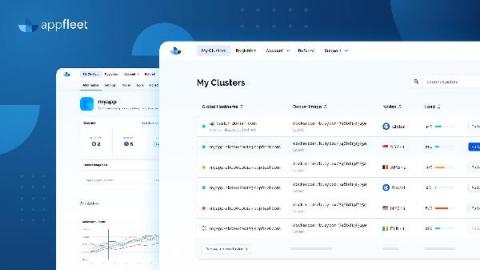
appfleet is now production ready!

First of all what is appfleet? appfleet is an edge compute platform that allows people to deploy their web applications globally. Instead of running your code in a single centralized location you can now run it everywhere, at the same time. In simpler terms appfleet is a next-gen CDN, instead of being limited to only serving static content closer to your users you can now do the same thing for your whole codebase. Run the whole thing where just your cache used to be.

Managing Docker Images with the JFrog Platform

Managing Docker images from development to production is a challenge for many companies looking to scale. IImages full of packages containing layers of different file types creates a needle in a haystack situation when hunting down security vulnerabilities or dependency issues. On top of worrying about what versions of what images are ready for release, in order to create a streamlined delivery process for Docker images, you also need to incorporate security into your pipeline. In this webinar, we will cover some important topics on why your teams should use Artifactory as your Docker Registry and the many benefits and advantages that come along with it.

12 Best Docker Container Monitoring Tools

Monitoring systems help DevOps teams detect and solve performance issues faster. With Docker and Kubernetes steadily on the rise, it’s important to get container monitoring and log management right from the start. This is no easy feat. Monitoring Docker containers is very complex. Developing a strategy and building an appropriate monitoring system is not simple at all.

Troubleshooting services on Google Kubernetes Engine by example

Applications fail. Containers crash. It’s a fact of life that SRE and DevOps teams know all too well. To help navigate life’s hiccups, we’ve previously shared how to debug applications running on Google Kubernetes Engine (GKE). We’ve also updated the GKE dashboard with new easier-to-use troubleshooting flows. Today, we go one step further and show you how you can use these flows to quickly find and resolve issues in your applications and infrastructure.

Announcing Support for GKE Autopilot

Google Kubernetes Engine (GKE) is the preferred way to run Kubernetes on Google Cloud as it removes the operational overhead of managing the control plane. Earlier today, Google Cloud announced the general availability of GKE Autopilot, which manages your cluster’s entire infrastructure—both the control plane and worker nodes—so that you can spend more time building your applications.