Dashboards

SquaredUp for SCOM - Quick Win Video Series - Part 3: Status Tile

In this series we take you through some of the fundamentals of building and designing your own dashboards. We look at some of the tile types and visualizations that are available, show you how to run SCOM agent tasks from SquaredUp, and finish up with an example of using a SquaredUp dashboard to troubleshoot an issue. This video focuses on the Status Tile. We’ll show you how to scope Donut, Blocks, and Icons Status tiles, including a brief look at how to add custom labels.

SquaredUp for SCOM - Quick Win Video Series - Part 4: TopN Performance

In this series we take you through some of the fundamentals of building and designing your own dashboards. We look at some of the tile types and visualizations that are available, show you how to run SCOM agent tasks from SquaredUp, and finish up with an example of using a SquaredUp dashboard to troubleshoot an issue. This video focuses on TopN scoped Performance tiles. We’ll show you how to scope a Bar Top N Performance tile, and also how to clone and edit a tile.

SquaredUp for SCOM - Quick Win Video Series - Part 5: Dashboard Actions

In this series we take you through some of the fundamentals of building and designing your own dashboards. We look at some of the tile types and visualizations that are available, show you how to run SCOM agent tasks from SquaredUp, and finish up with an example of using a SquaredUp dashboard to troubleshoot an issue. This video focuses on the dashboard actions feature. We’ll show you how to configure actions, including running SCOM tasks, and adding external and internal links.

SquaredUp for SCOM - Quick Win Video Series - Part 6: NOC Dashboard

In this series we take you through some of the fundamentals of building and designing your own dashboards. We look at some of the tile types and visualizations that are available, show you how to run SCOM agent tasks from SquaredUp, and finish up with an example of using a SquaredUp dashboard to troubleshoot an issue. This video focuses on how to create a NOC dashboard. We’ll bring together what we’ve learned so far in this video series, whilst also introducing the Matrix tile, and show you how to share your dashboard using our Open Access feature.

SquaredUp for SCOM - Quick Win Video Series - Part 7: Using a NOC Dashboard

In this series we take you through some of the fundamentals of building and designing your own dashboards. We look at some of the tile types and visualizations that are available, show you how to run SCOM agent tasks from SquaredUp, and finish up with an example of using a SquaredUp dashboard to troubleshoot an issue. This video focuses on how to use a NOC dashboard. We’ll now use a NOC dashboard, and the drilldowns in SquaredUp, to help us resolve a problem in our environment.

How to stream Graphite metrics to Grafana Cloud using carbon-relay-ng

In this post we’ll show how you can easily ship your existing Graphite metrics to Grafana’s managed metric offering using carbon-relay-ng. Carbon-relay-ng is a fast, go-based carbon-relay replacement that allows you to easily aggregate, filter and route your Graphite metrics. This post assumes you have a local carbon-relay-ng binary. You can download carbon-relay-ng binaries from the releases page and find documentation on Docker images, Linux packages, and how to build it yourself here.

How to maximize span ingestion while limiting writes per second to a Scylla backend with Jaeger tracing

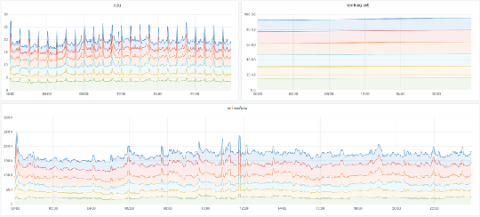
Jaeger primarily supports two backends: Cassandra and Elasticsearch. Here at Grafana Labs we use Scylla, an open source Cassandra-compatible backend. In this post we’ll look at how we run Scylla at scale and share some techniques to reduce load while ingesting even more spans. We’ll also share some internal metrics about Jaeger load and Scylla backend performance. Special thanks to the Scylla team for spending some time with us to talk about performance and configuration!

Create Customized Dashboards for End to End Visibility Over Your Entire Network

With employees scattered into an assortment of different IT environments, it can be a challenge to keep track of all the data you’re receiving from your various monitoring platforms. Using dashboards to sort and filter potential action items is an essential need of efficiently using they resources you have. In this #ITConnections session we will go over some of the best practices to creating dashboards that will effectively handle your business.

How blocks storage in Cortex reduces operational complexity for running Prometheus at massive scale

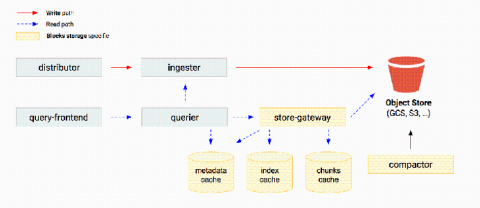
Cortex is a long-term distributed storage for Prometheus. It provides horizontal scalability, high availability, multi-tenancy and blazing fast query performances when querying high cardinality series or large time ranges. Today, there are massive Cortex clusters storing tens to hundreds of millions of active series with a 99.5 percentile query latency below 2.5s.

How we're using 'dogfooding' to serve up better alerting for Grafana Cloud

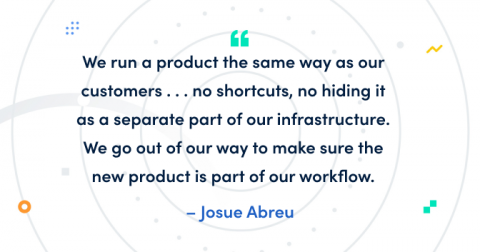
At Grafana Labs, we’re big fans of putting ourselves in the shoes of our customers. So when it comes to building a product, dogfooding is a term we throw around constantly. In short, what it means is that we actually use the products we create throughout their entire life cycle. And I really mean the whole life cycle.