Operations | Monitoring | ITSM | DevOps | Cloud

The latest News and Information on DevOps, CI/CD, Automation and related technologies.

Kubernetes Incident Management Best Practices

Creating just any infrastructure on Kubernetes is not enough. There are so many basic configurations you could apply and create the infrastructure for your application for the time being and it might work just fine. The incident responses won’t always remain 100% reliable. You will run into newer potholes, and that’s okay.

Getting started with AWS CloudWatch

Out of more than 100 services that Amazon Web Services (AWS) provides, Amazon CloudWatch was one of the earliest services provided by AWS. CloudWatch was announced on May 17th, 2009, and it was the 7th service released after S3, SQS, SimpleDB, EBS, EC2, and EMR. AWS CloudWatch is a suite of tools that encompasses a wide range of cloud resources, including collecting logs and metrics; monitoring; visualization and alerting; and automated action in response to operational health changes.

What is Scalability?

The number of simultaneous requests that an application can successfully support is a measure of its scalability. The point at which an application can no longer successfully handle more requests is its scalability limit. When a key piece of hardware is exhausted and new or more machines are needed, this limit is reached. Scaling these resources can include any combination of CPU and physical memory (different or more computers), hard disc (larger hard drives, less "live" data, solid state drives), and/or network bandwidth (several network interface controllers, larger NICs, fibre, and so on).

Cloud connectivity and interoperability

The post-pandemic world has transformed our work habits and the landscape of conducting business. Organizations now take the hybrid approach to work, wherein employees may work from an office, while travelling, or from a remote location. This fundamental shift has accelerated the pace of cloud adoption, as the cloud makes data access possible from anyplace, anytime. But the cloud brings with it a set of complexities that must be managed.

Using Grafana and Graphite to monitor server load

Since server outages can lead to a loss of customers, reputation, and other troubles and it is important to get information on the status of the server on time. MetricFire's Hosted Grafana and Graphite will help you monitor server load in a timely and efficient manner. Servers generate a large number of metrics and it is essential to not only track their values but also to observe their changes over time. There is also a possibility to correlate app statistics with server load metrics.

AWS Cost Allocation: A Guide To Allocating Cloud Spend

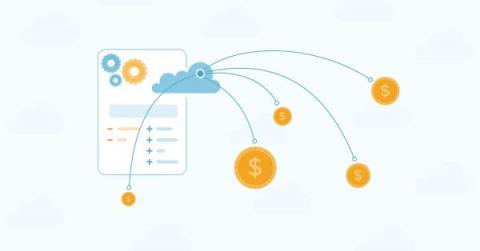
Picture this. Over 90% of organizations use the cloud in one form or another, according to O'Reiley's research. Cloud computing is so popular because of its flexibility. Because you can access cloud computing resources on-demand, you can automatically increase or decrease resource usage depending on your workload, which is incredibly appealing — and quite different from traditional IT infrastructure. In 2023, controlling cloud spend is one of the greatest challenges for cloud users today.